INEEID Network seminar, online

Project ArHa A global record of arenavirus and hantavirus sampling in small mammals, and what it can do David Simons Department of Ecology and Genetics, Uppsala University 20 October 2026

The Gaps

Arenavirus detected
Hantavirus detected
Both
Tested, none detected
Not tested
Country or adm1 centroid

Project ArHa v1.1, sampling locations

The problem

  • Host-pathogen records are scattered across decades of papers, reports and languages
  • Sampling events and outcomes presented in a range of formats
  • Non-detections are rarely reported, so absence and not-looking look the same
  • Without sampling effort, bias cannot be separated from biology

How we built it

How the ArHa database is built Extracted literature and four external sources feed five processing stages: citations, hosts, pathogens, sequences, then quality checks. They produce one relational database, released as open tables. SOURCESPROCESSINGOUTPUT Extracted literature 728 studies GBIF backbone GADM boundaries NCBI Taxonomy GenBank 1 · Citations screening decisions, study descriptions 2 · Hosts which species, where, when, with what effort; non-detections added where effort is clear 3 · Pathogens test results for each host record 4 · Sequences accessions linked to host and pathogen records 5 · Quality checks and assembly QA report, consistent names and order Relational database five linked tables Open release Darwin Core and parquet tables versioned DOI on Zenodo explorer app

Search, screen, extract
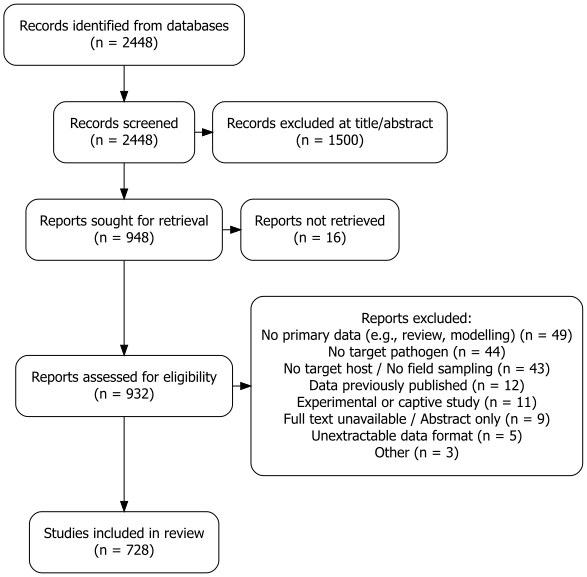

PRISMA flow diagram: 2,448 records screened, 1,500 excluded at title and abstract, 948 reports sought, 932 assessed for eligibility, 728 studies included.

QR code linking to the Project ArHa protocol in Wellcome Open Research.

Protocol, Wellcome Open Research
doi.org/10.12688/wellcomeopenres.24037.2

Harmonisation

Harmonising studies that report at different scales Four kinds of source record, a single sequenced animal, a species count from years at one site, counts broken down by site or session, and individual animal data, are resolved to the finest time and space available, with dates, coordinates, names and assays standardised. The result is a host record linked to a pathogen measurement. The end point is a shared data standard. AS REPORTEDHARMONISEDAS STORED One animal reported because a virus was sequenced from it One count a species total from four years at a single site Stratified count species totals broken down by site or session Individual animals each with its own date, place and result Resolve the sampling unit the finest time and space available for each animal sampled; pathogen status kept at its own scale, e.g. pooled tests Datesdozens of formats Coordinatesformats and precision Nameshost and virus taxonomy Assaysfree text to set terms Host record species, where, when, how many Pathogen measurement virus, assay, tested, positive linked The end point: a data standard If studies report in a shared format, this work is done once, at source. Minimum data standard, Scientific Data 2025.

What it contains

728 studies

54,984 host records

4,942 locations in 103 countries

748 host species

~695,000 tests for arenaviruses and hantaviruses

Four linked tables

The four tables of the ArHa release Sampling events, 729 rows, link to host occurrences, 54,984 rows. Each host occurrence links to pathogen measurements, 69,186 rows, and to sequence links, 13,860 rows, which point to GenBank. Sampling events study-level details reference, year, protocol, sampling effort 729 Host occurrences the central table species, place, date, number of animals, trap nights, coordinate precision 54,984 Pathogen measurements virus, assay, number tested, number positive 69,186 Sequence links GenBank accessions for host and virus sequences 13,860 eventID occurrenceID occurrenceID

Darwin Core tables: Event, Occurrence, MeasurementOrFact, ResourceRelationship

Where we look, and where we don’t

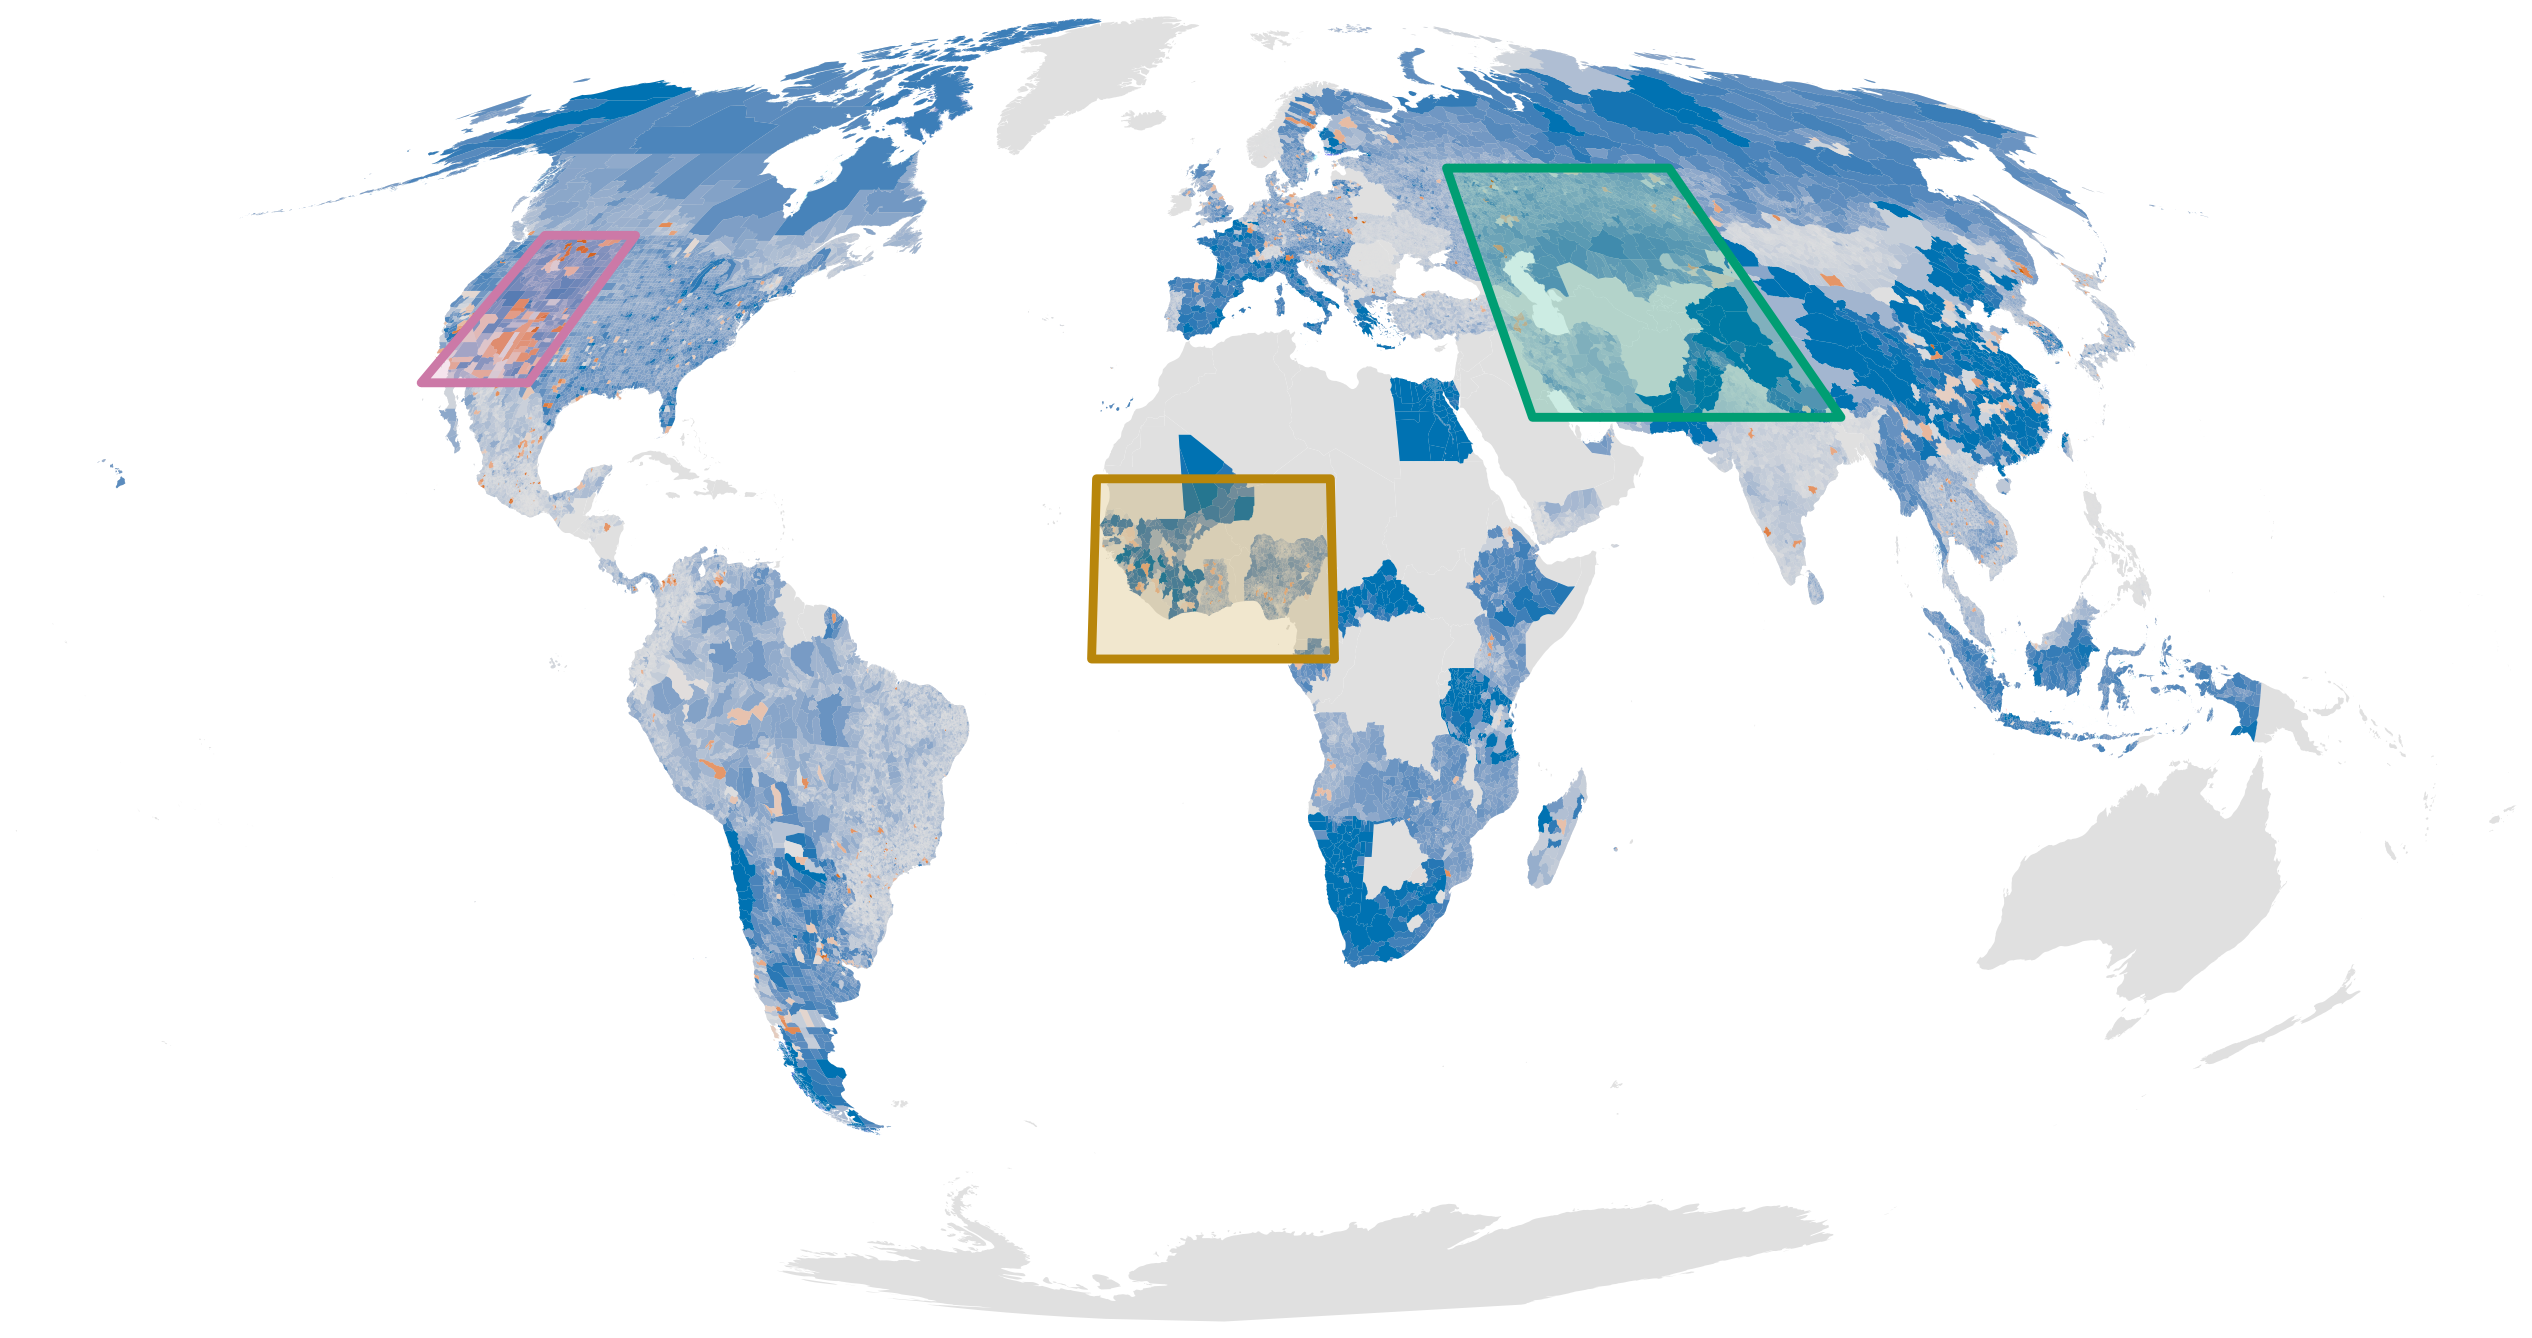
World map of surveillance residuals: districts sampled more (orange) or less (blue) than predicted by night-time light, accessibility, population density and host richness, with boxes marking the Intermountain West, West Africa and Central Asia.

Colour key: surveillance gap, log10 of observed over predicted, from -2 (blue, undersampled) to 2 (orange, oversampled).

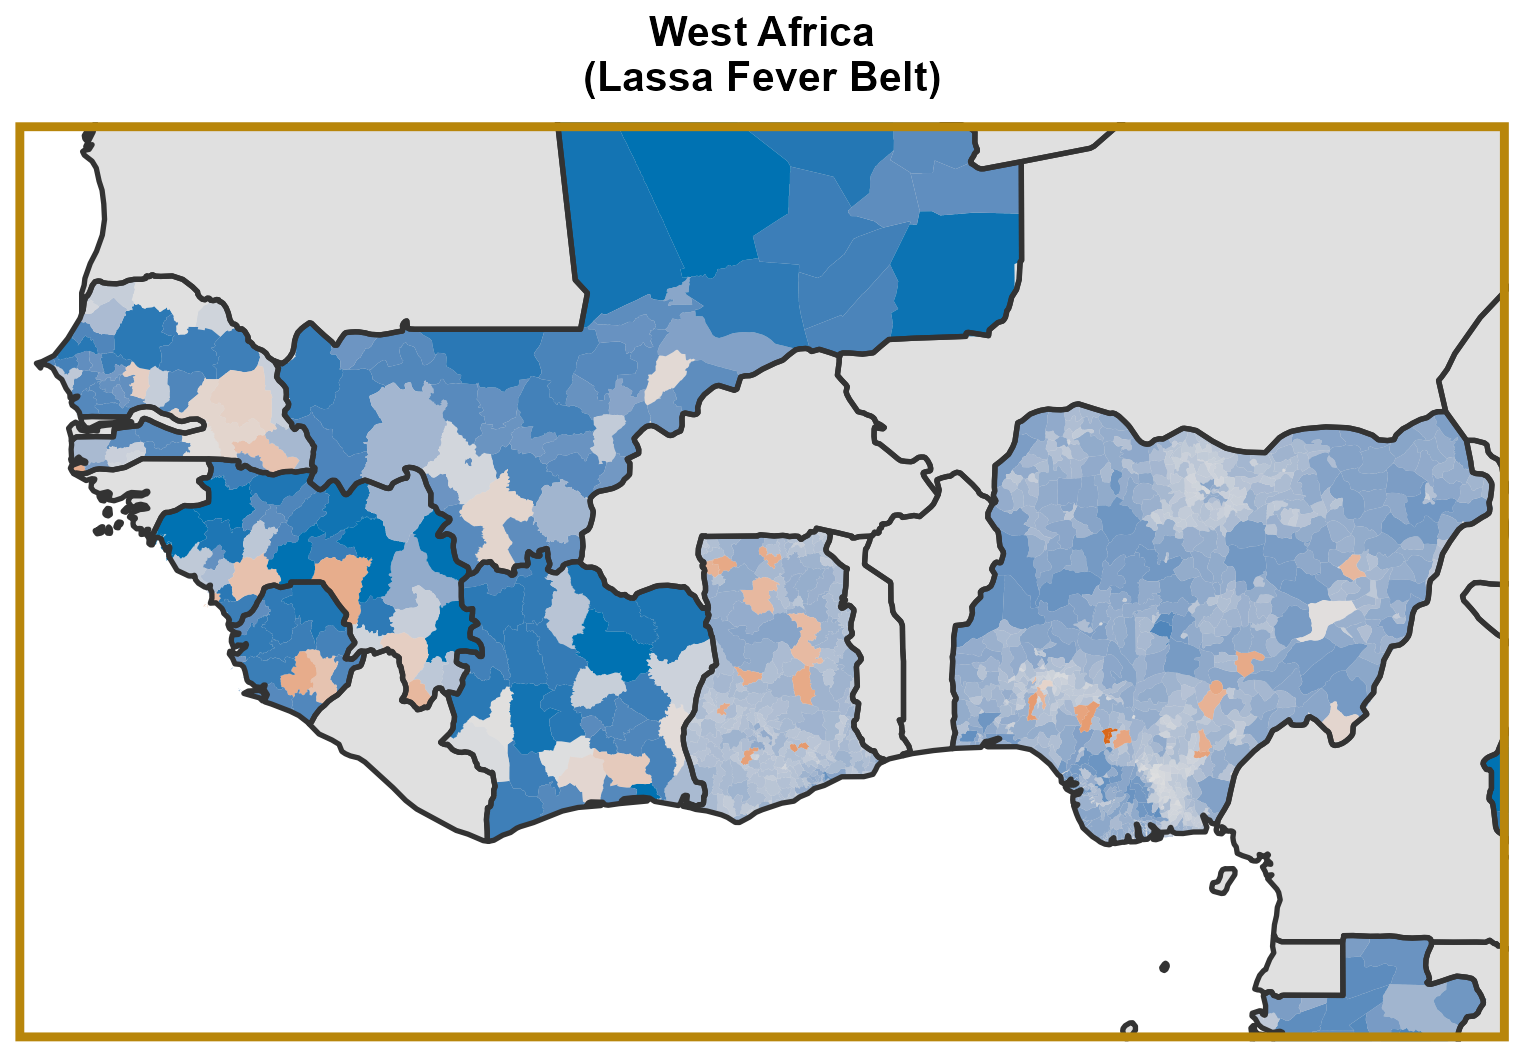
Inset: West Africa, the Lassa fever belt.

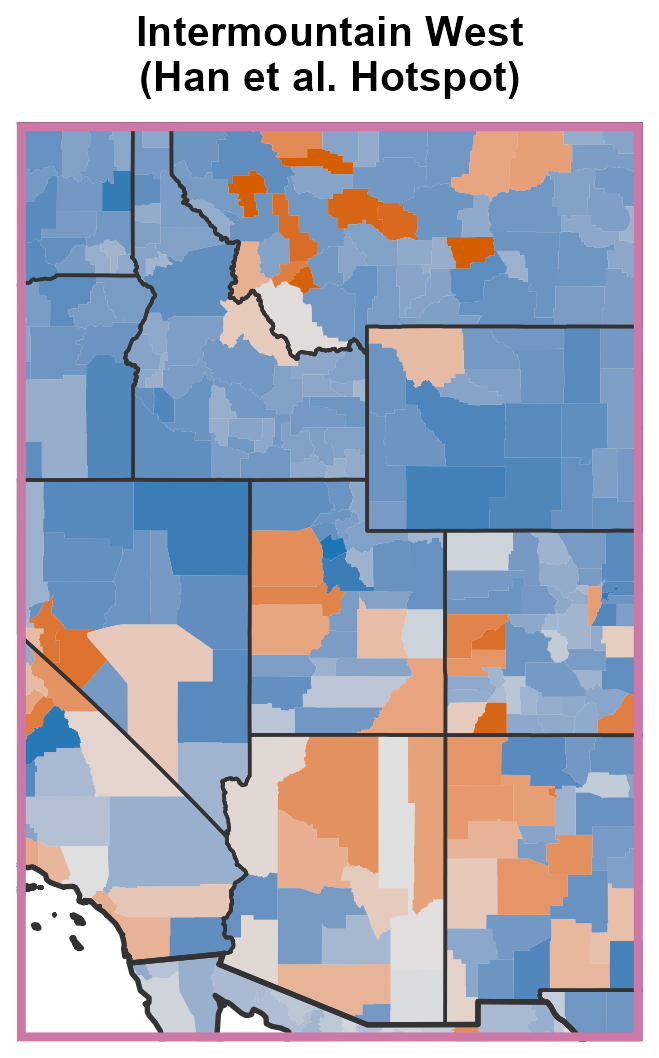
Inset: the Intermountain West of the United States, a hotspot in Han et al.

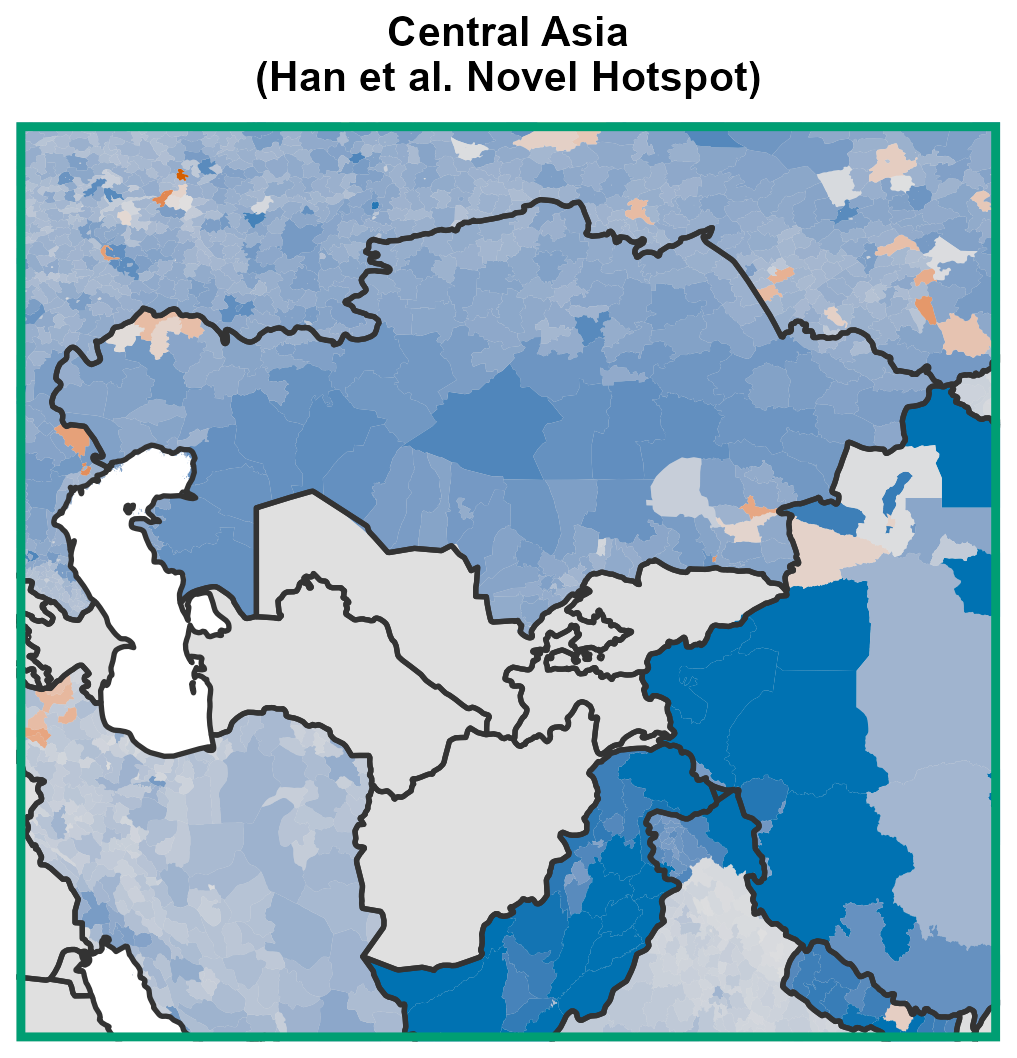
Inset: Central Asia, a novel hotspot in Han et al., largely undersampled.

Questions addressed using the whole database

What predicts host status

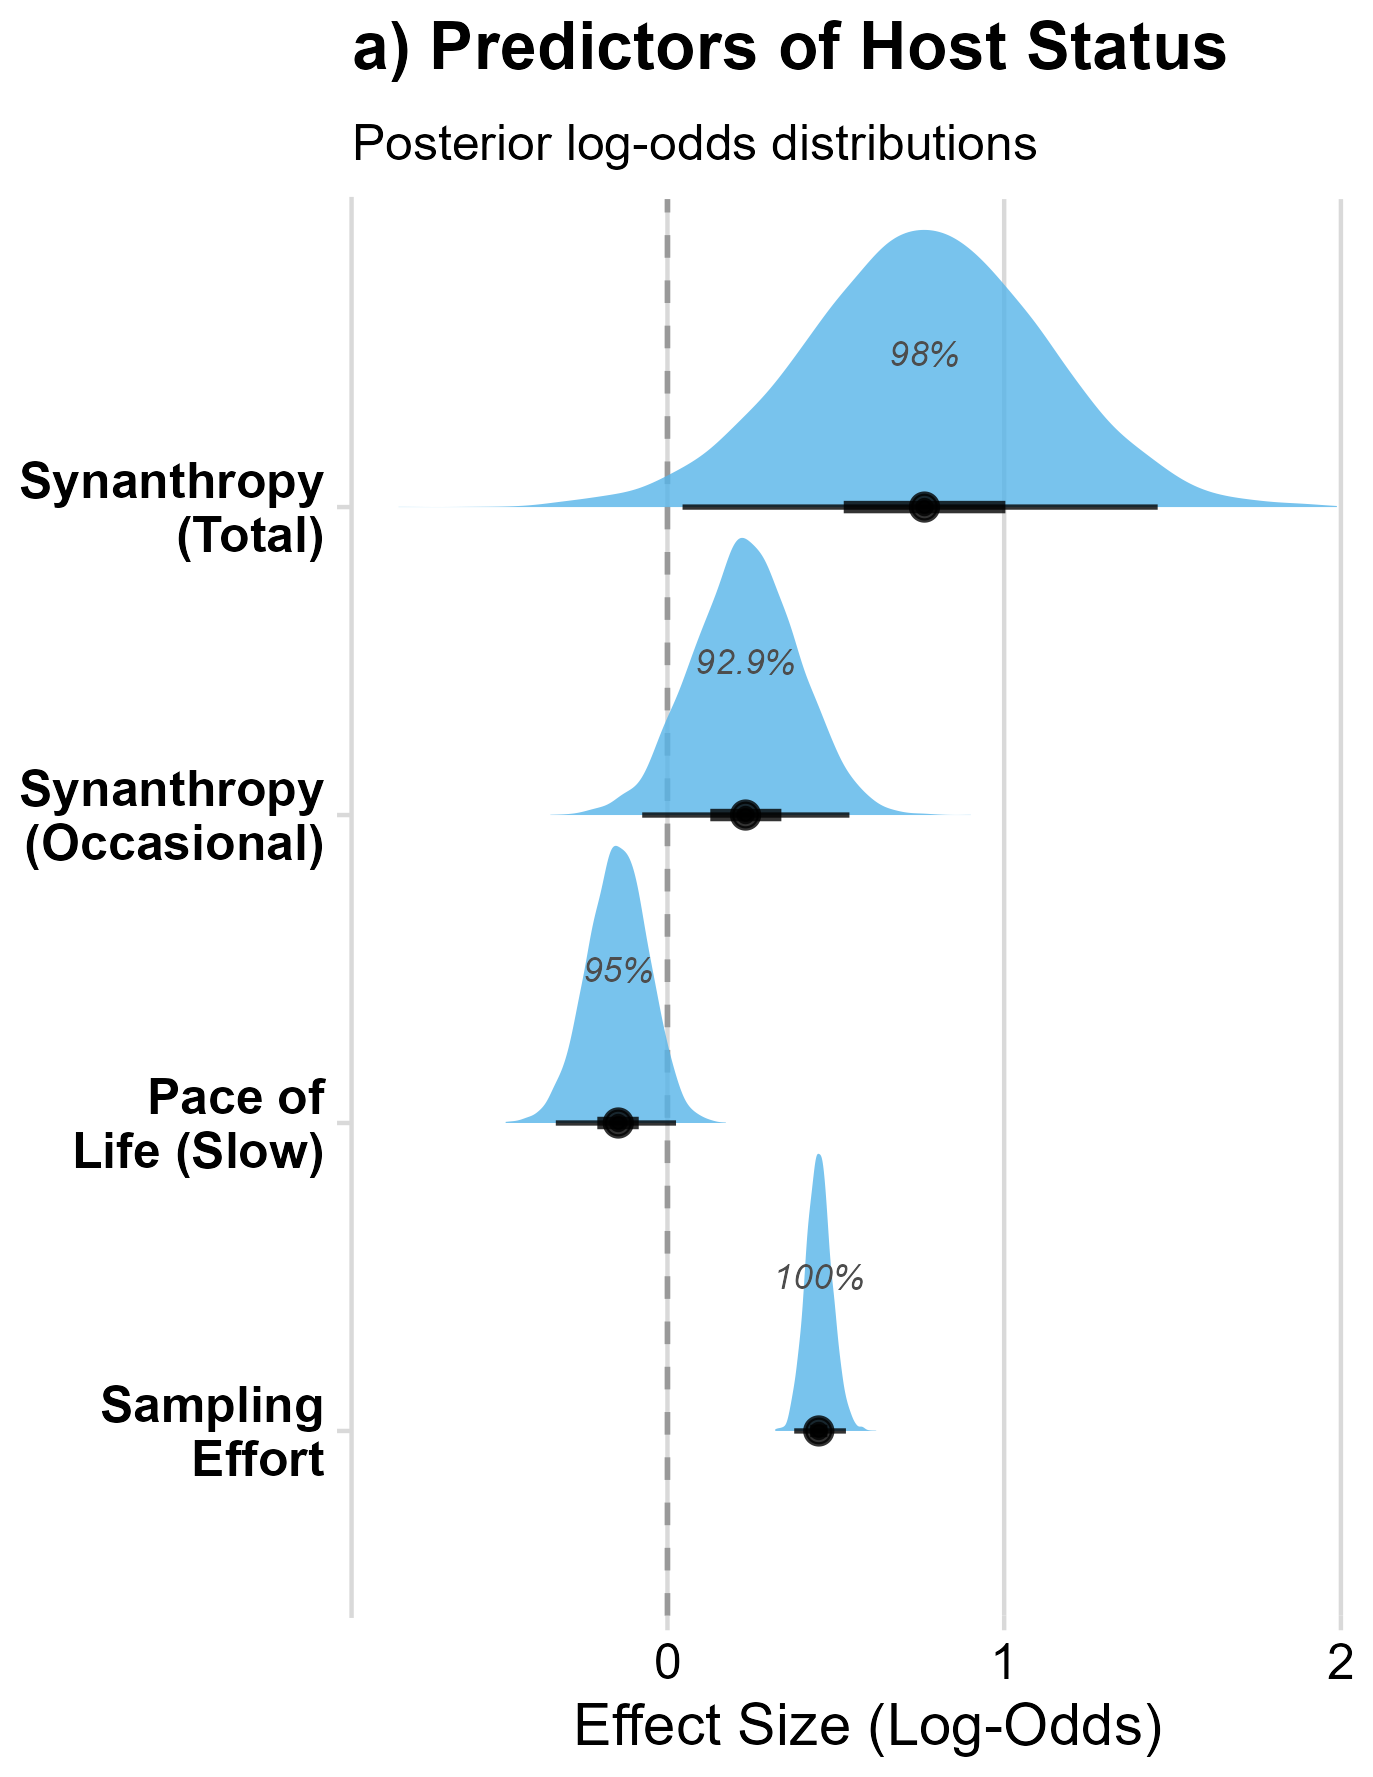
Posterior log-odds for total and occasional synanthropy, slow pace of life and sampling effort.

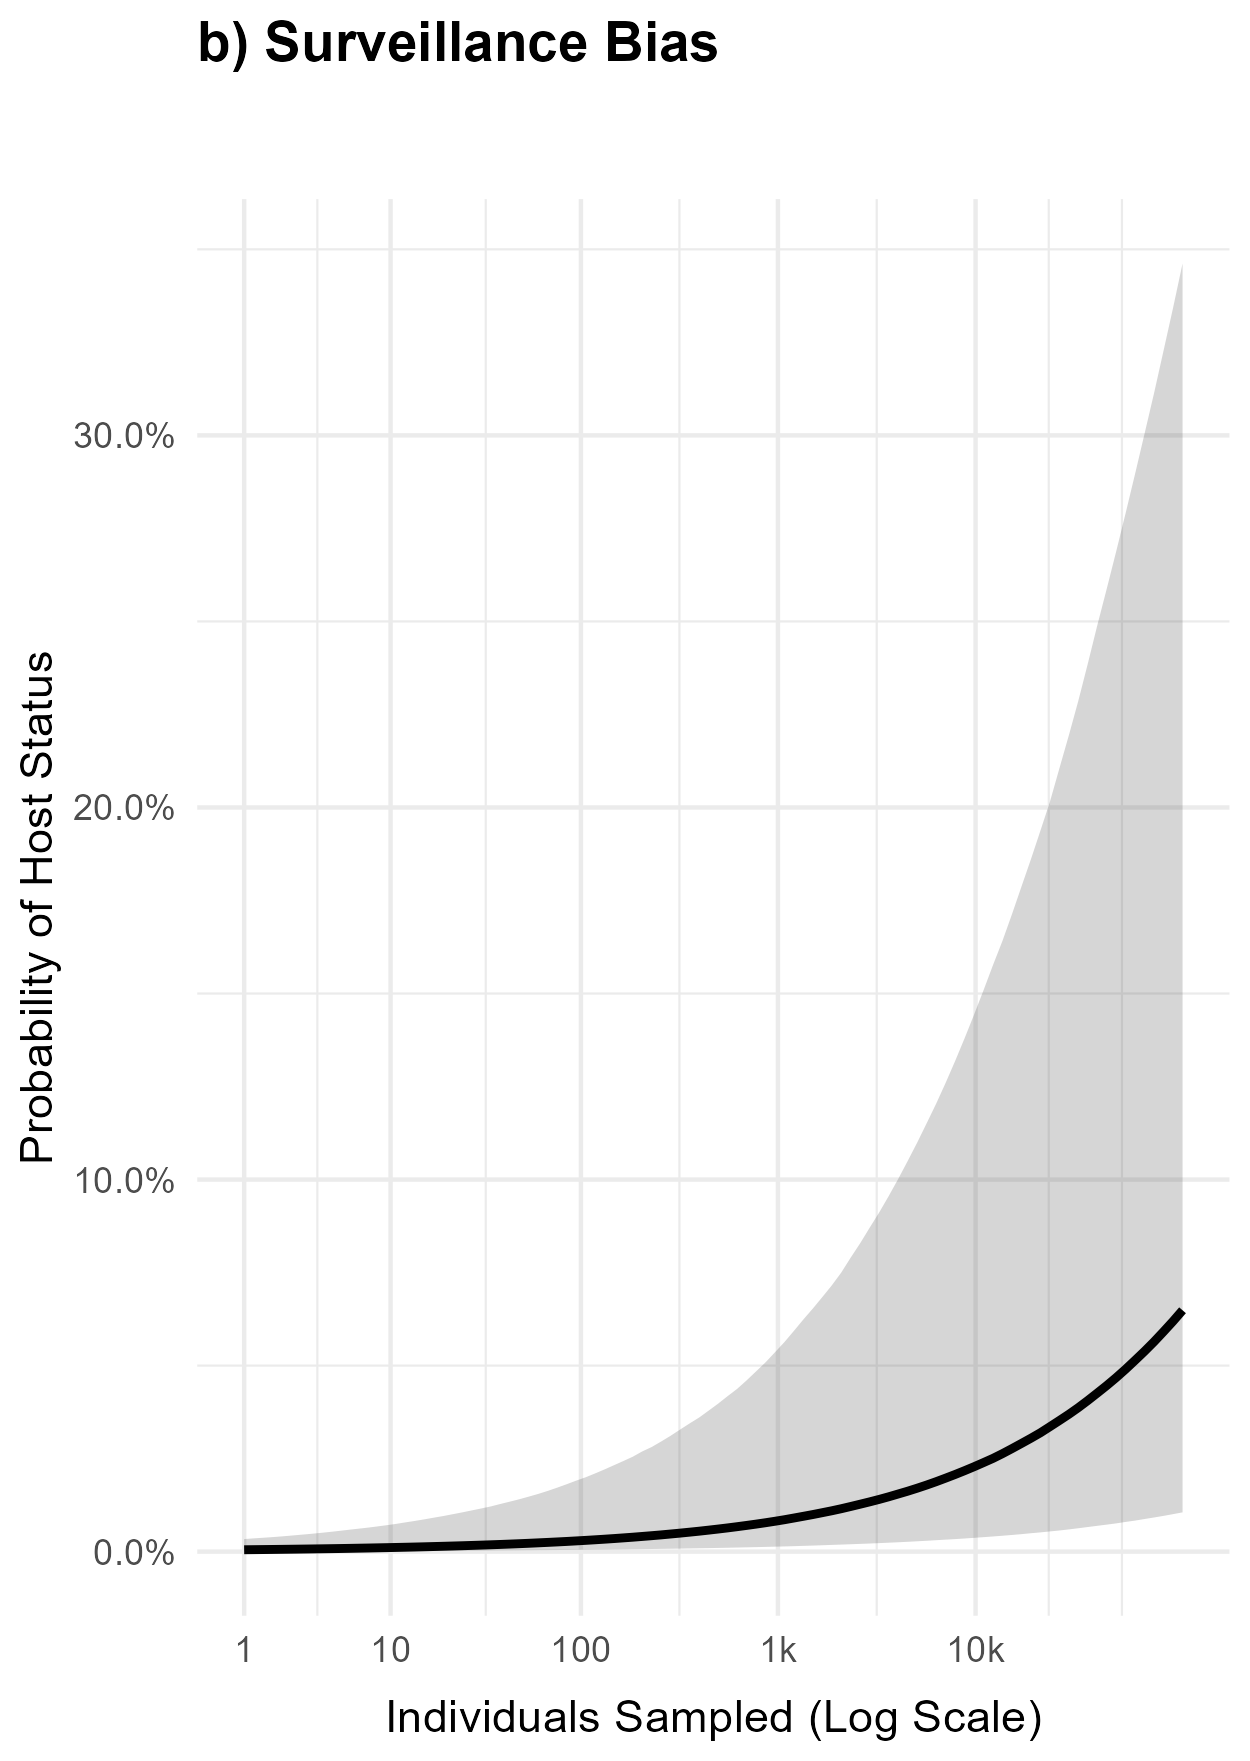
Probability of host status rising with the number of individuals sampled, on a log scale.

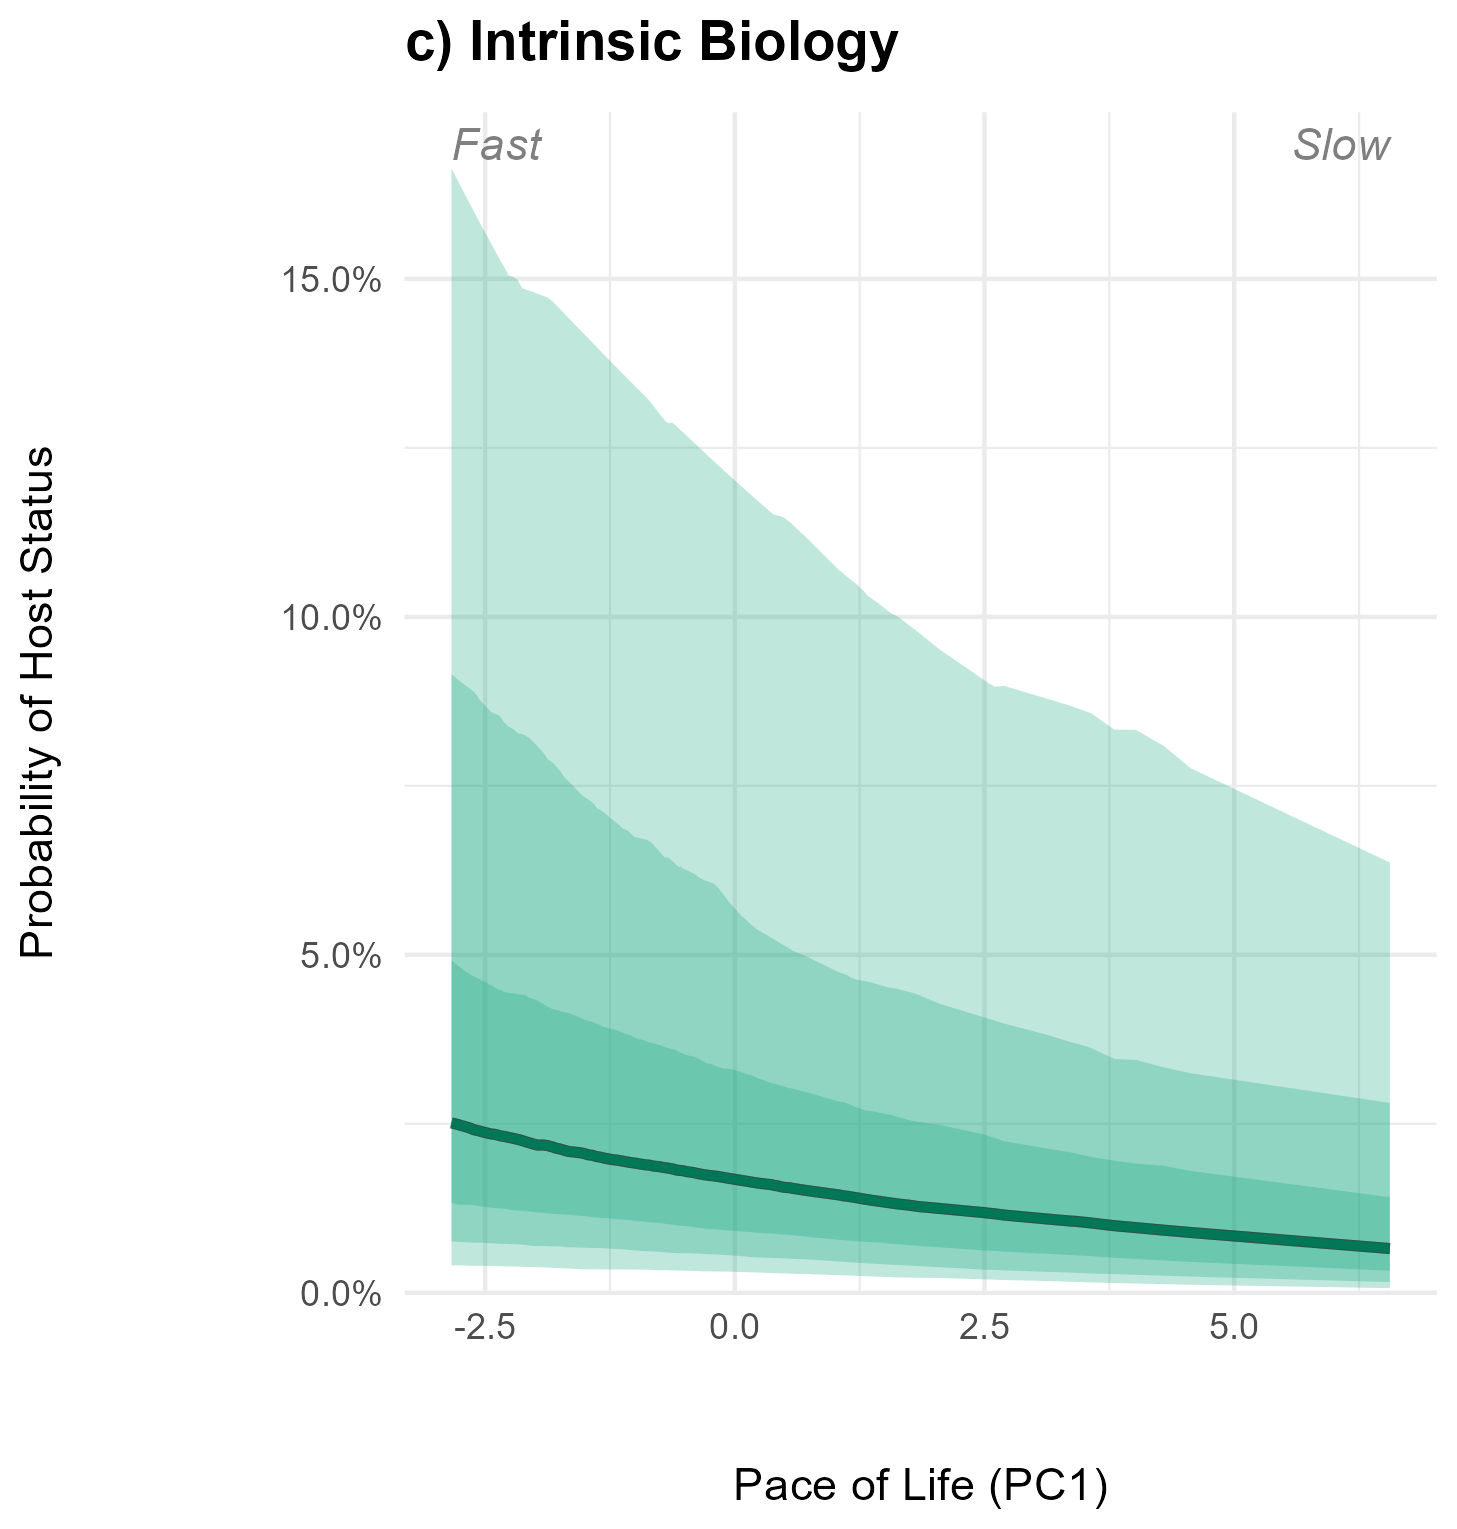
Probability of host status falling from fast to slow pace of life.

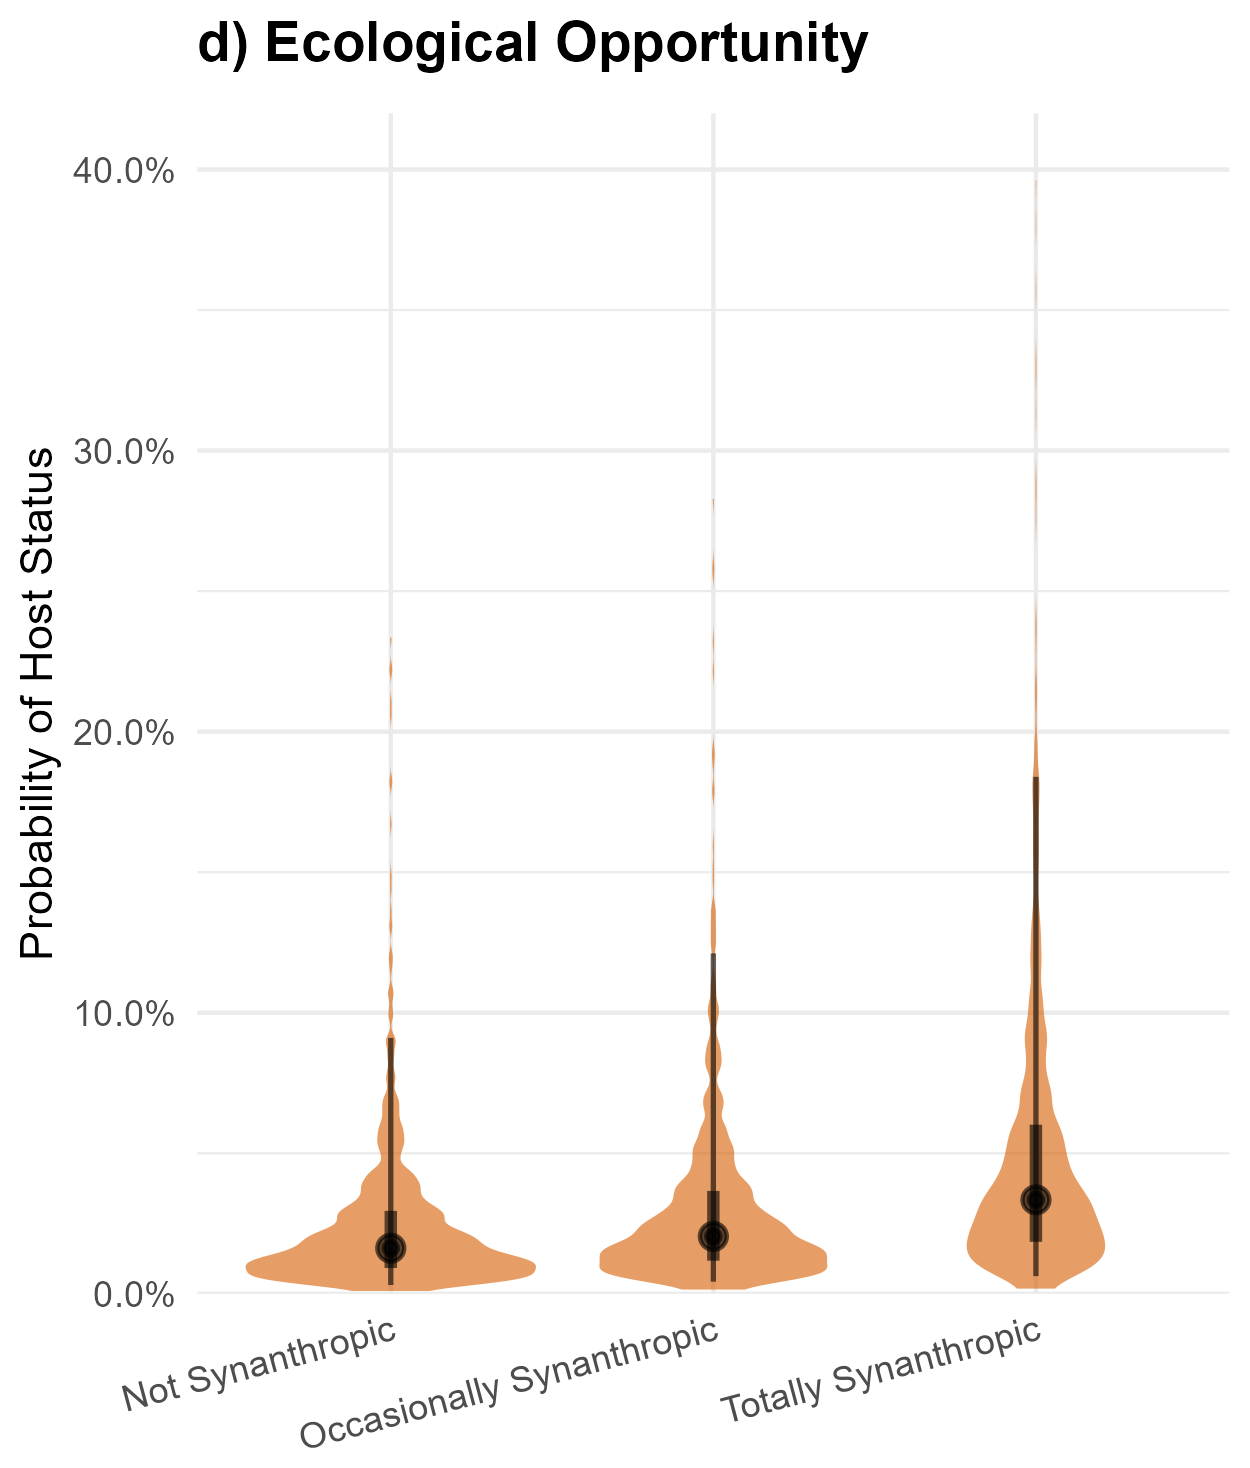
Probability of host status for non-, occasionally and totally synanthropic species, highest for totally synanthropic.

Life history: Cronin 2014, Am Nat; Ostfeld 2014, PLoS ONE. Ecological opportunity: Kamiya 2014, Biol Rev. Urban-adapted species: Albery 2022, Nat Ecol Evol.

QR code linking to the macroecology preprint on bioRxiv. Preprint
bioRxiv

Hosts and viruses share a history, but not strictly
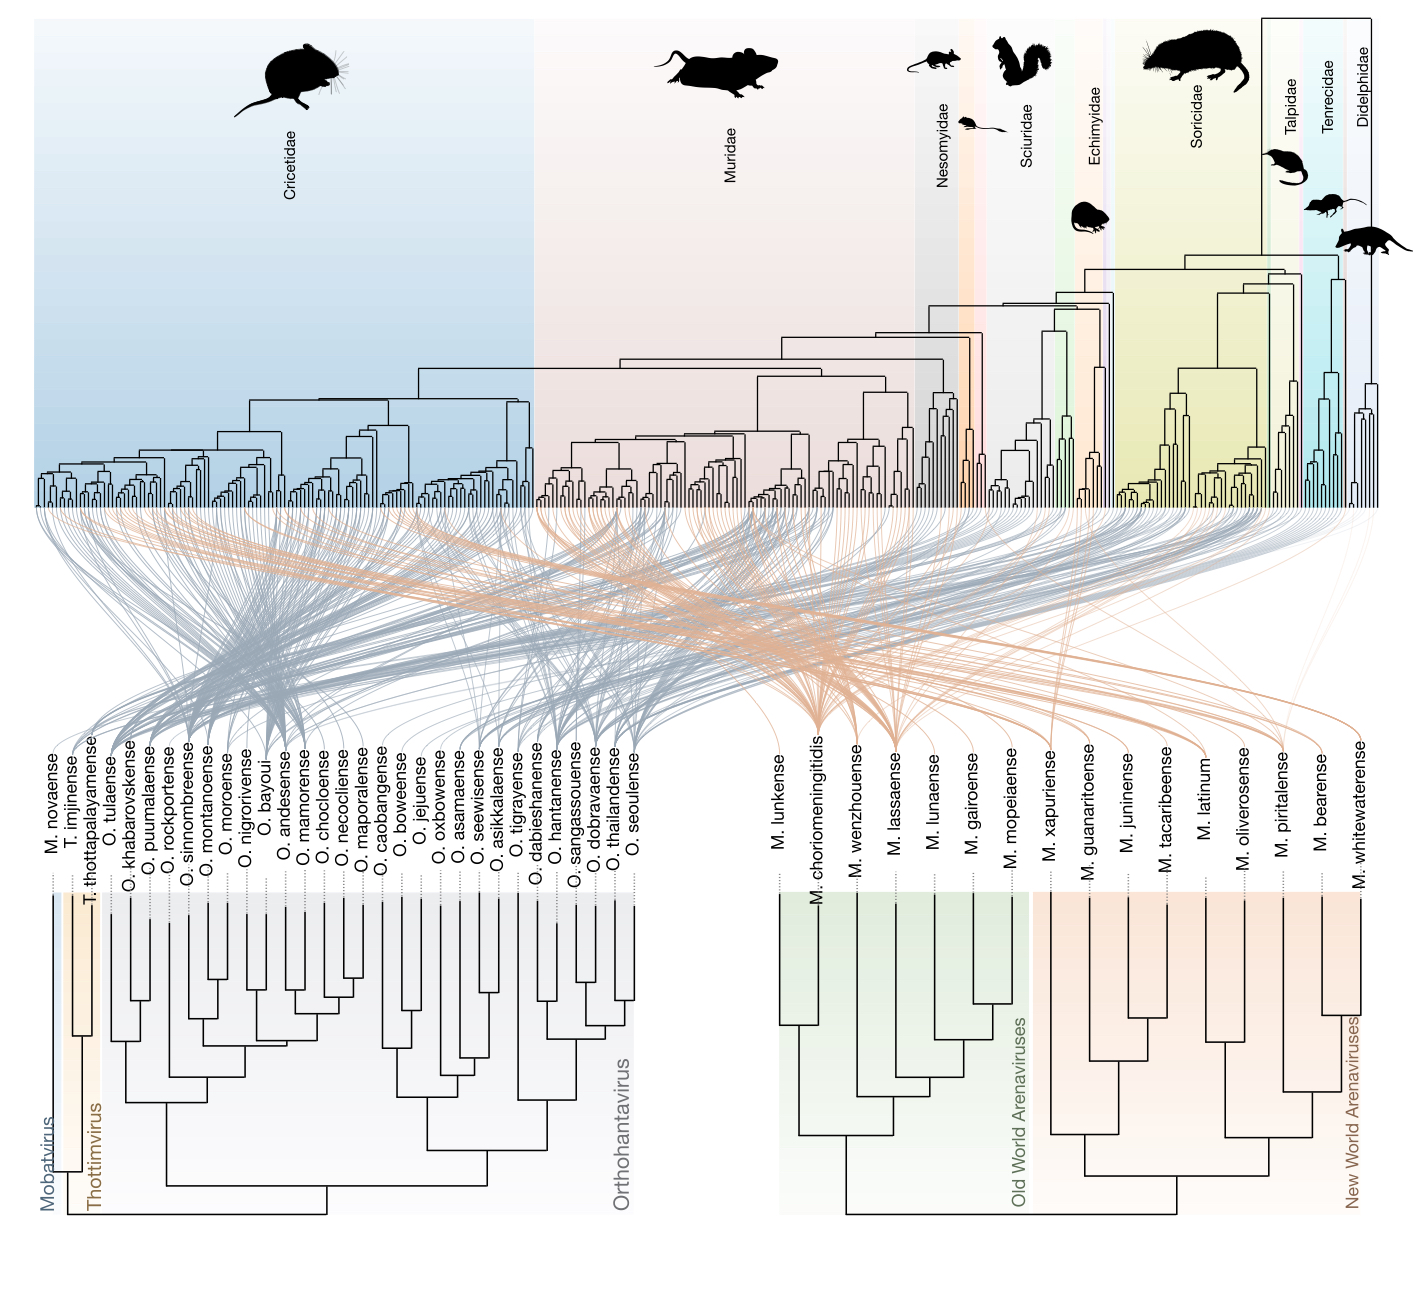
Tanglegram linking the mammalian host phylogeny above to hantavirus and arenavirus phylogenies below, with many crossing links.

No codivergence in hantaviruses: Ramsden 2008, Mol Biol Evol. PACo: Balbuena 2013, PLoS ONE.

Where host probability is high
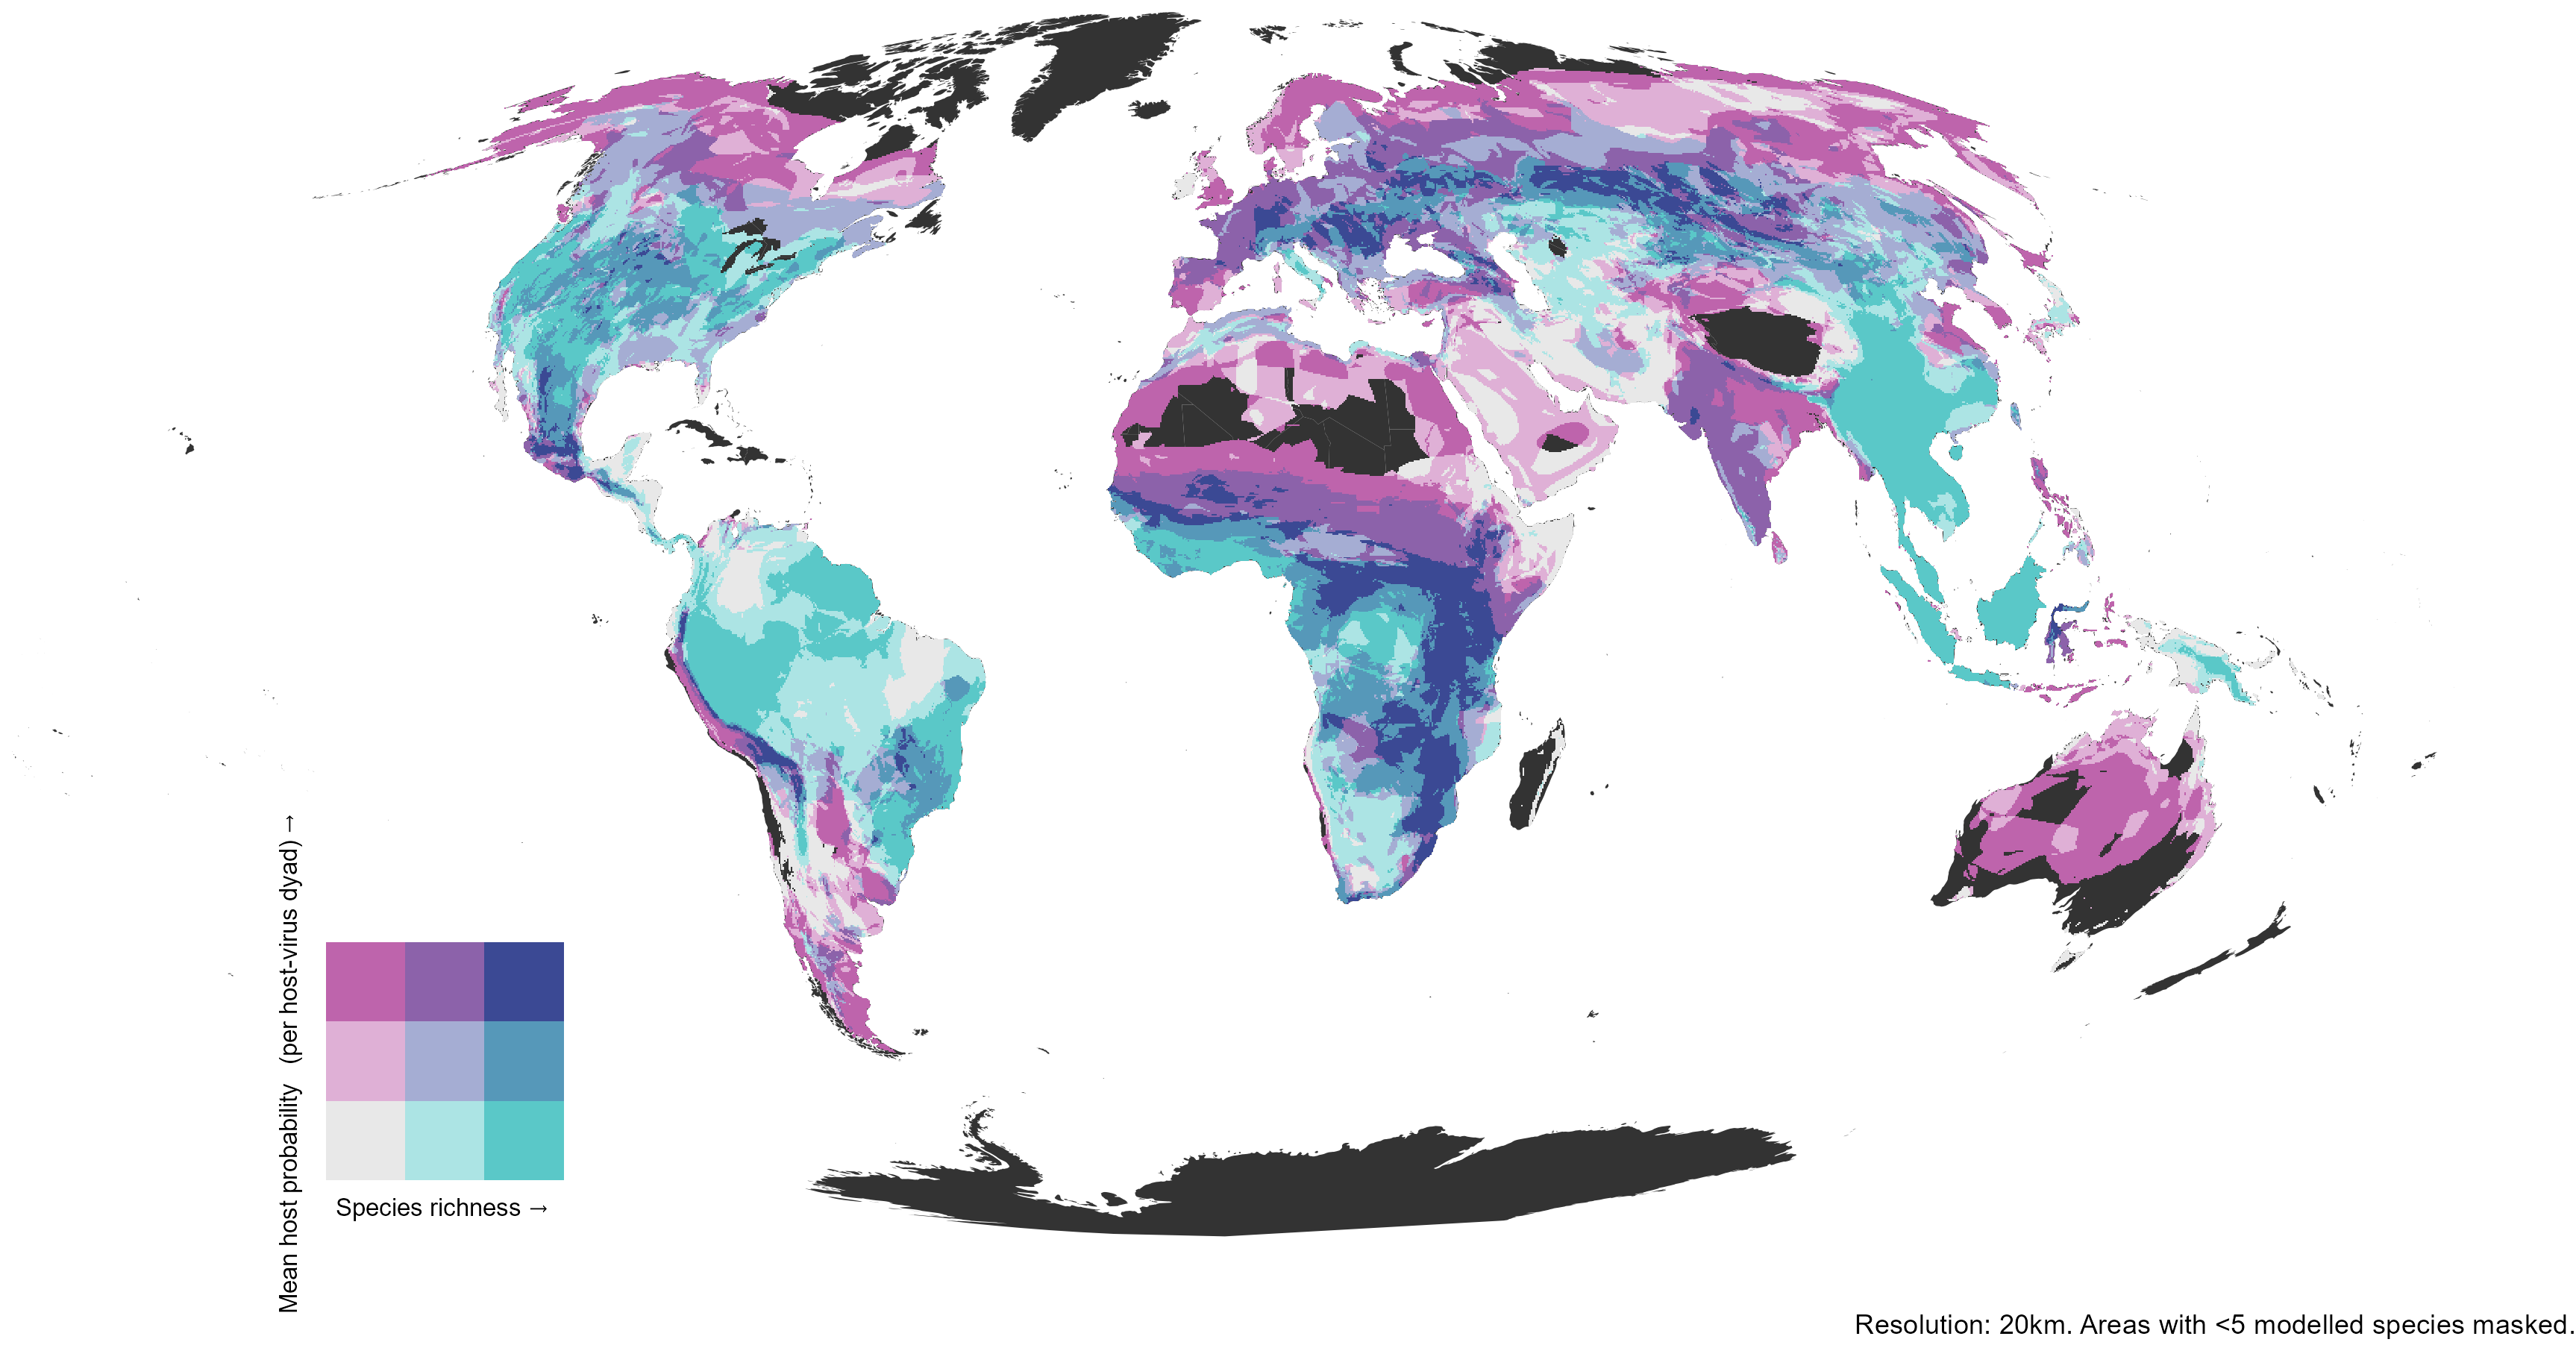
Bivariate world map of small-mammal species richness against community host probability at 20 km resolution.

Biodiversity and disease: Keesing 2010, Nature. Zoonotic hosts in human-dominated land: Gibb 2020, Nature.

Questions able to be addressed using subsets of the database

Reassortment in orthohantaviruses

  • 553 genomes, seven orthohantavirus species, 1983 to 2024
  • Local host overlap is the strongest ecological correlate of reassortment
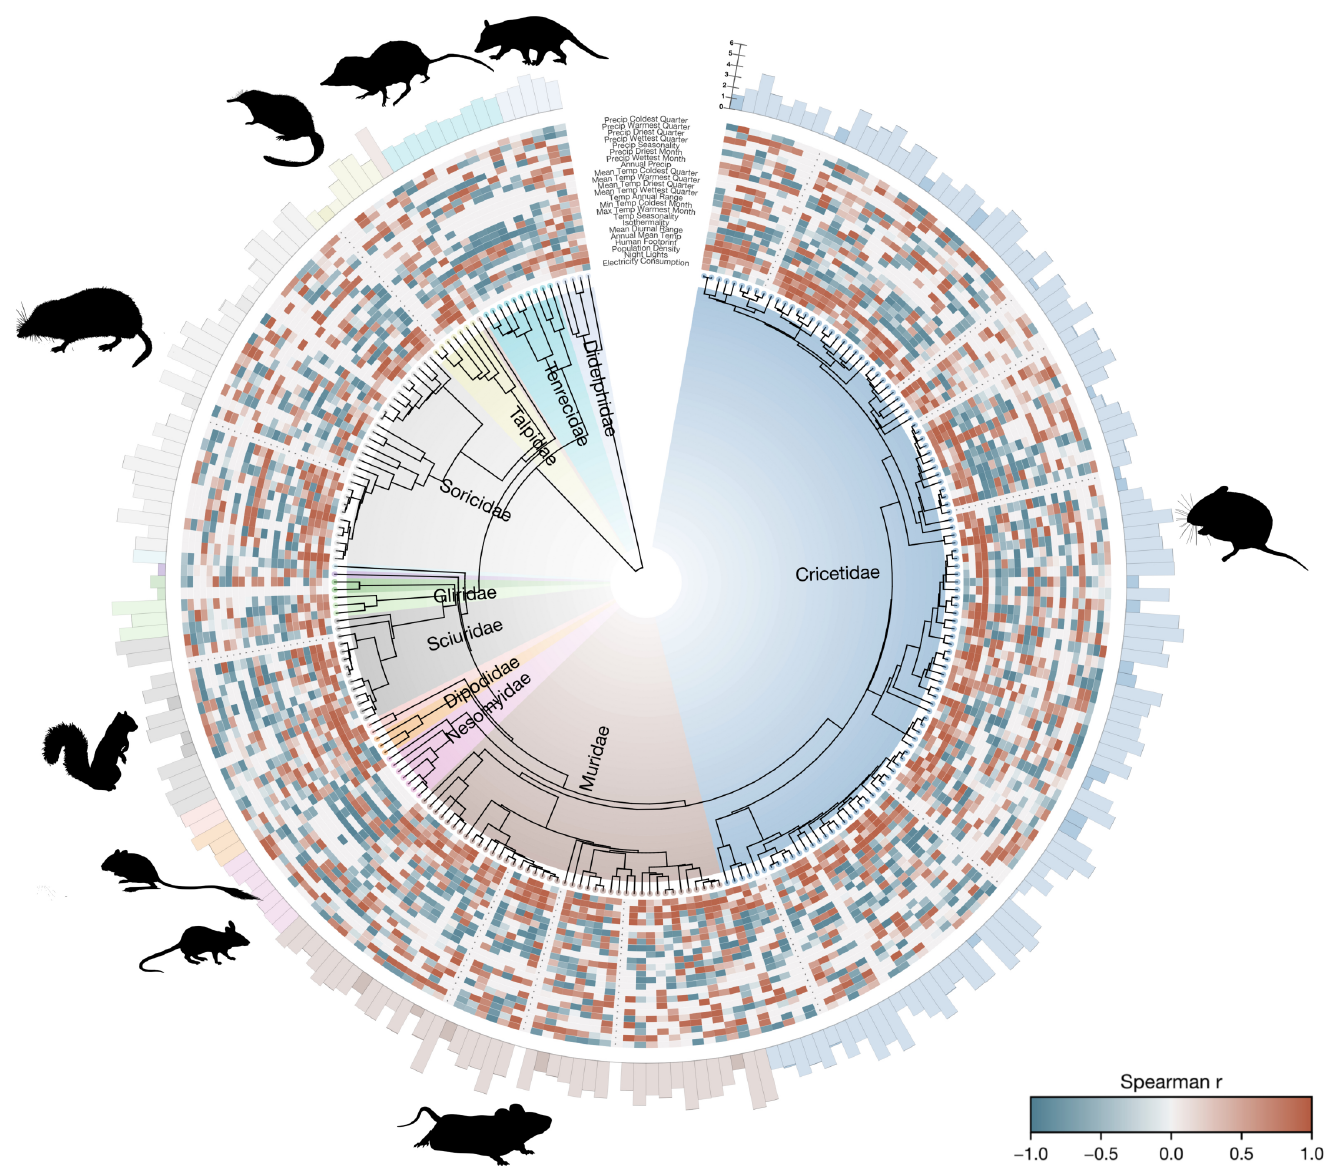
Circular phylogeny of small-mammal host species by family, ringed by heat maps of how each environmental covariate relates to each host's distribution model, with silhouettes of representative species.

Rivero et al. 2026, bioRxiv, 10.64898/2026.06.10.731004. Figure 2b, CC BY 4.0.

Lassa virus spillover, revisited

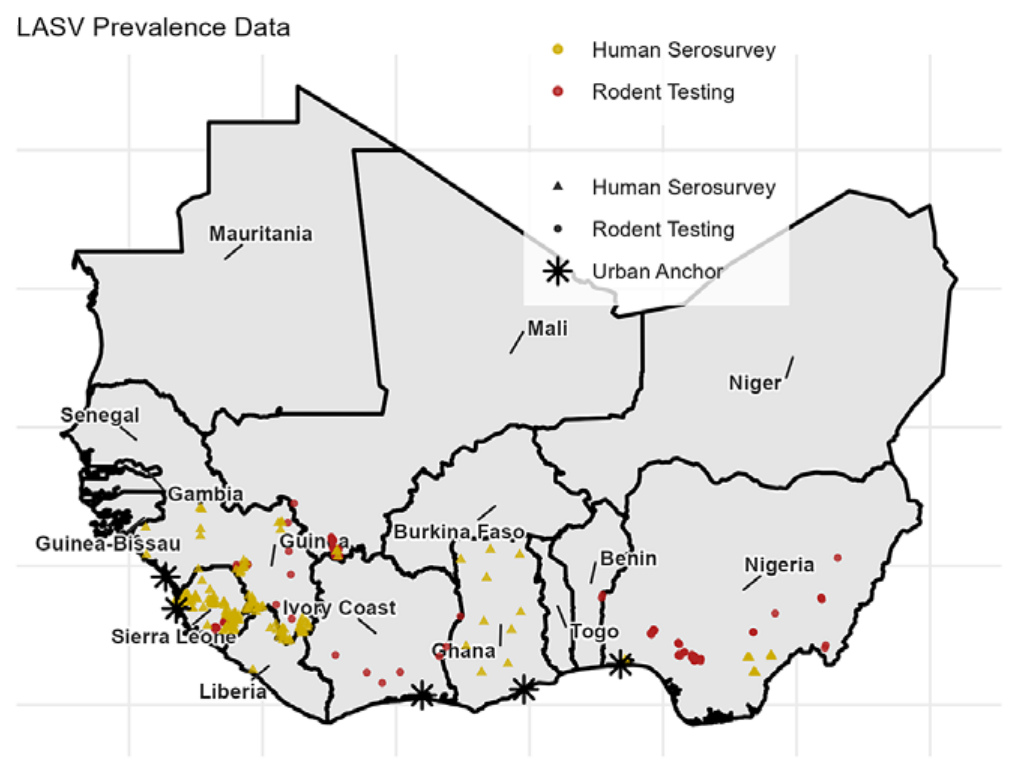
  • Basinski et al. 2021 estimated infections across West Africa
  • Using ArHa I could build on their framework to incorporate biotic interactions
  • Eskew et al. found competition between Mastomys natalensis and Rattus rattus modifies spillover risk
  • M. natalensis occurrence modelled within a community of 8 sympatric small-mammal species
  • Why no outbreaks in major cities, where the hospitals and laboratories are?
    • Across 32 diseases, outbreak risk peaks in mosaic landscapes, and reporting falls with travel time to care (Gibb et al. 2026, Nature)
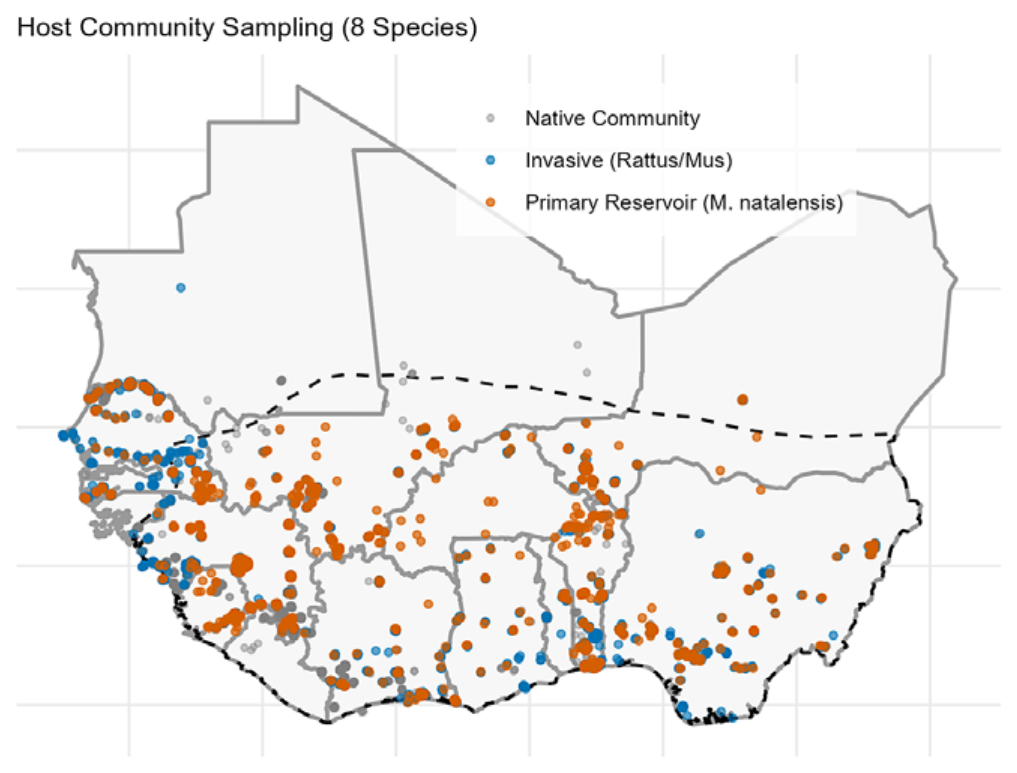
Small-mammal trapping locations across West Africa: Mastomys natalensis, invasive Rattus and Mus, and the native community.

Lassa virus prevalence data: rodent testing sites, human serosurveys and urban absence anchors across West Africa.

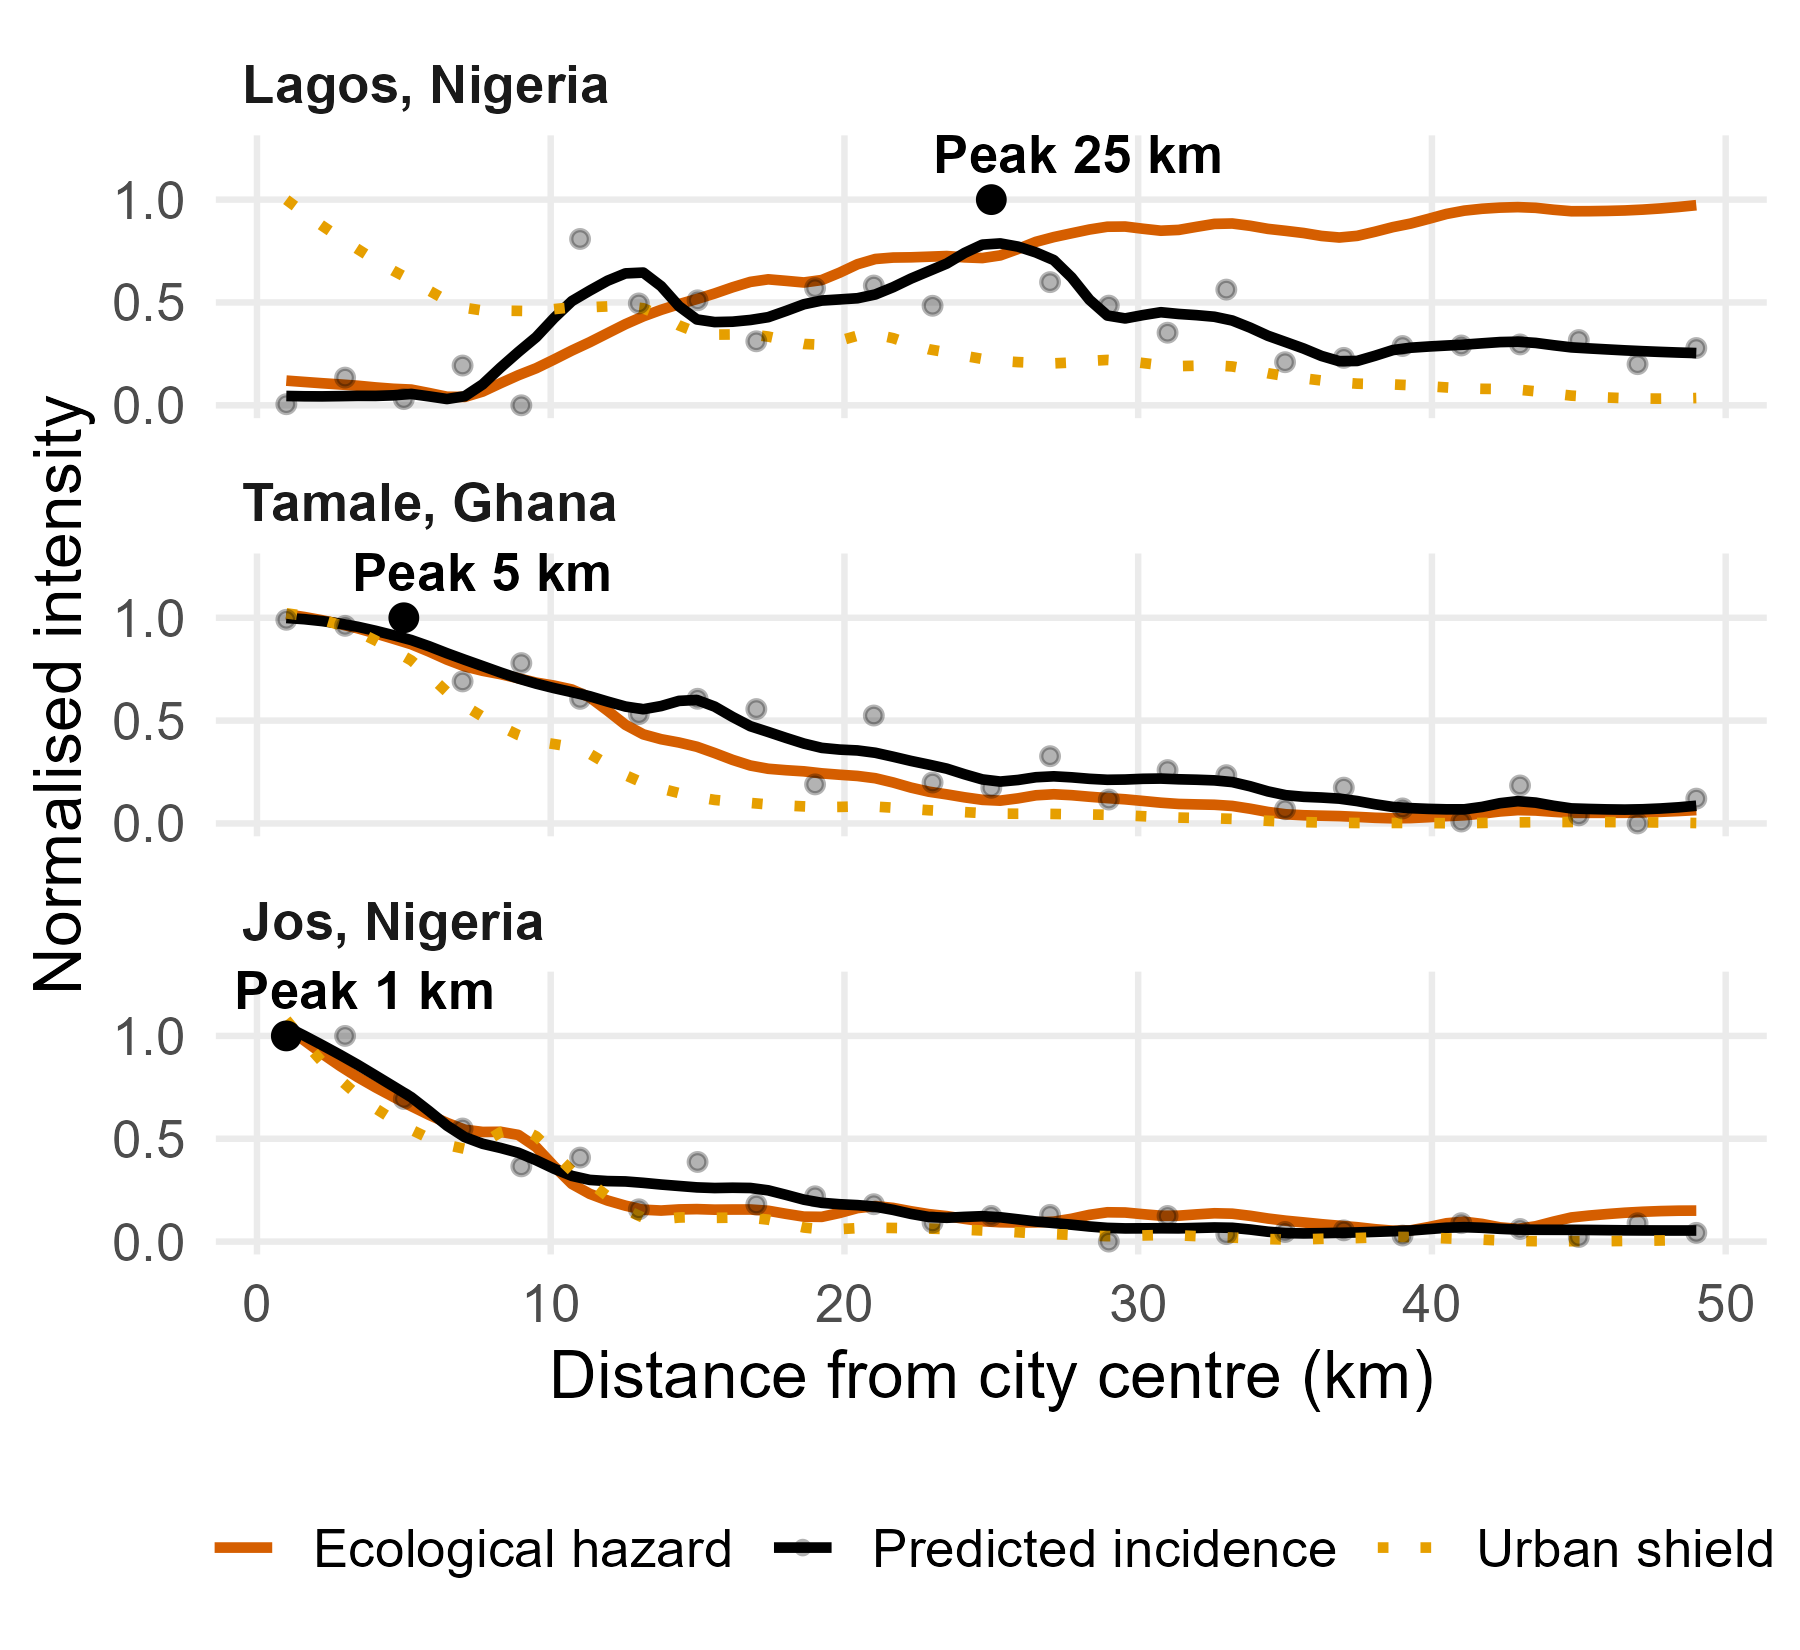
Radial profiles of ecological hazard, predicted incidence and the urban shield from the centres of Lagos, Tamale and Jos. In Lagos hazard rises outward and incidence peaks 25 km out; in Tamale and Jos all three fall from the centre.

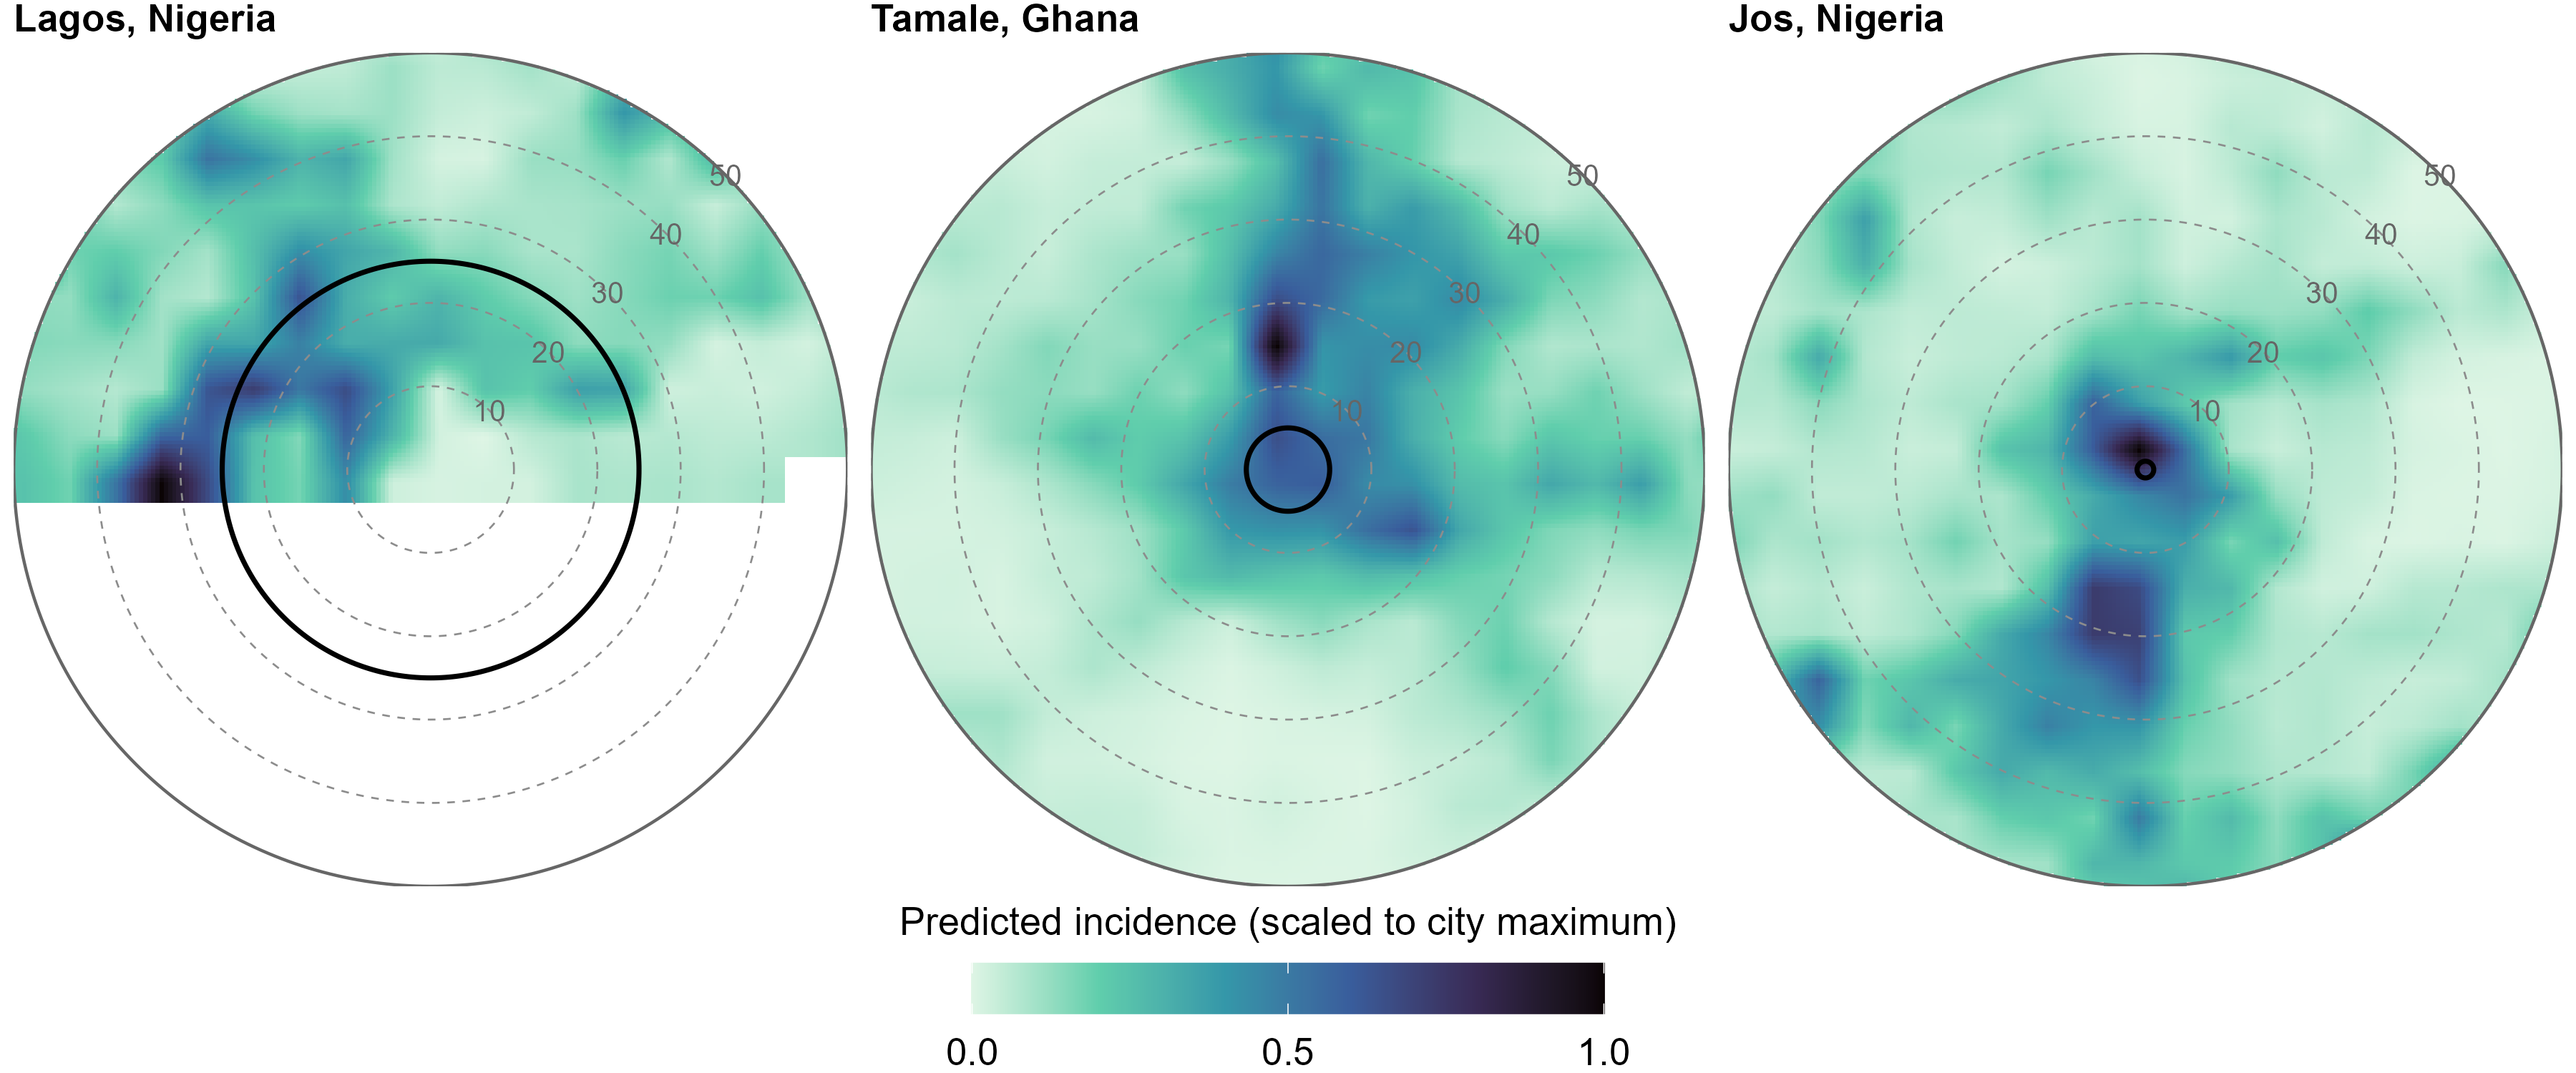
Maps of predicted Lassa fever incidence within 50 km of Lagos, Tamale and Jos, on the same scale for each city. Lagos is half sea, with incidence spread through its hinterland; in Tamale and Jos incidence concentrates near the centre.

Black circle: distance of maximum predicted incidence. Rings every 10 km.

Spillover framework: Basinski 2021, PLoS Comput Biol.
Socio-economic shield: Simons 2026, Epidemiol Infect.

Rapid response: Andes virus, 2026

  • An outbreak aboard the cruise ship MV Hondius: 11 confirmed cases, 3 deaths
  • The index case’s public record of their activities was integrated with modelled outputs from ArHa using:
    • Rodent occurrences
    • Antibody prevalence
    • Viral sequences
  • Using these three layers we resolved exposure to the southern-Andean focus of Oligoryzomys longicaudatus, not the Tierra del Fuego landfill that drew the media attention
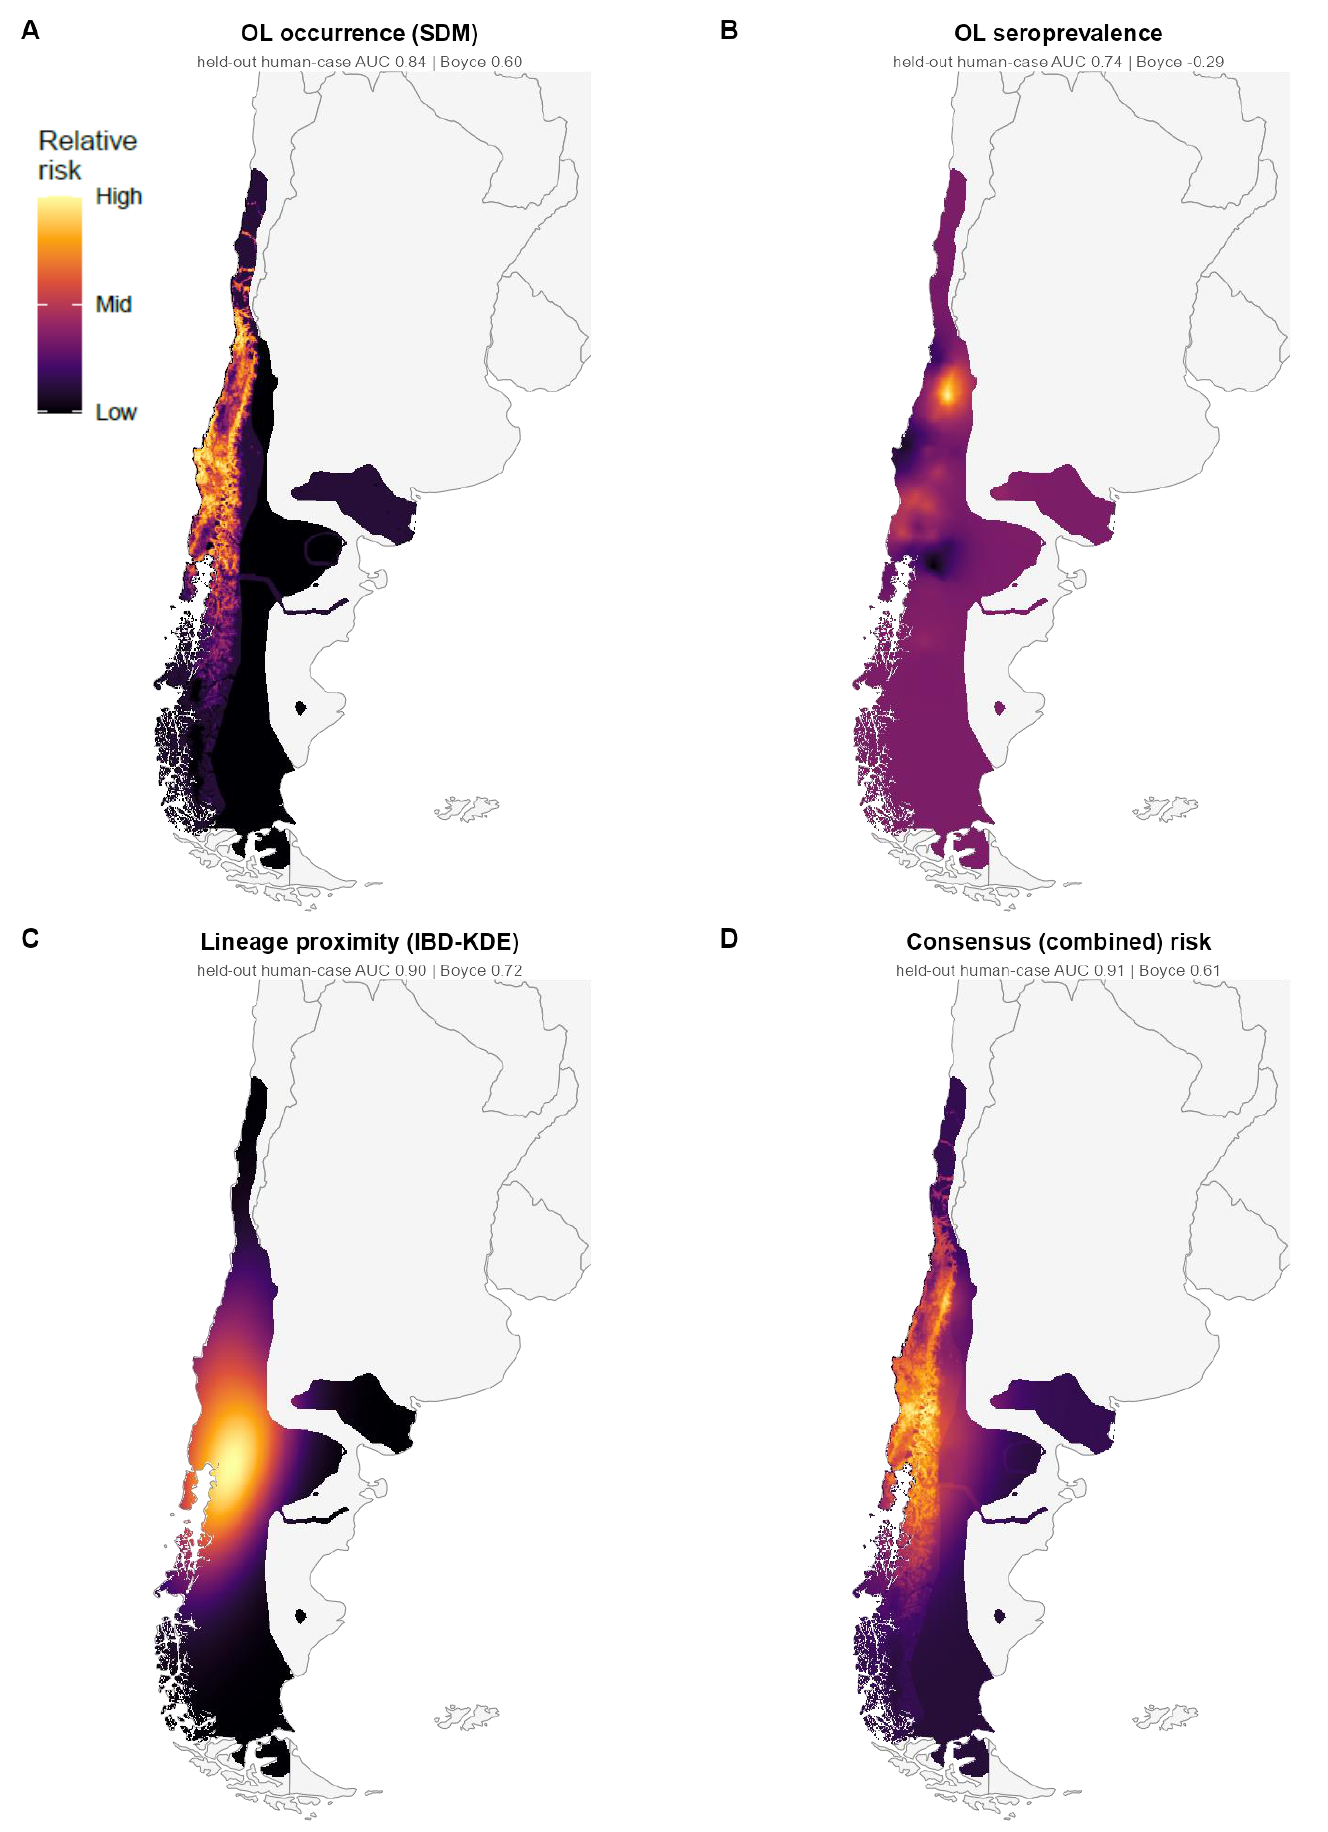
Four maps of Patagonia: reservoir occurrence, reservoir seroprevalence, proximity to the human-transmissible lineage, and their consensus, converging on north-western Patagonia.

Redding et al. 2026, medRxiv, 10.64898/2026.09.28.26364179. Figure 4, CC BY 4.0.

What next

Optimising sampling for surveillance

  • Host distribution models give a biodiversity dose: where the hosts of a pathogen are likely to be
  • Uncertainty in those models shows where occurrence sampling would teach us most
  • A priority score balances discovery sampling against prevalence sampling where dose is high
  • Balanced-acceptance sampling spreads sites out, rather than clustering them in one hot spot
  • I am operationalising this with Chungnam National University, South Korea, for hantaviruses and scrub typhus
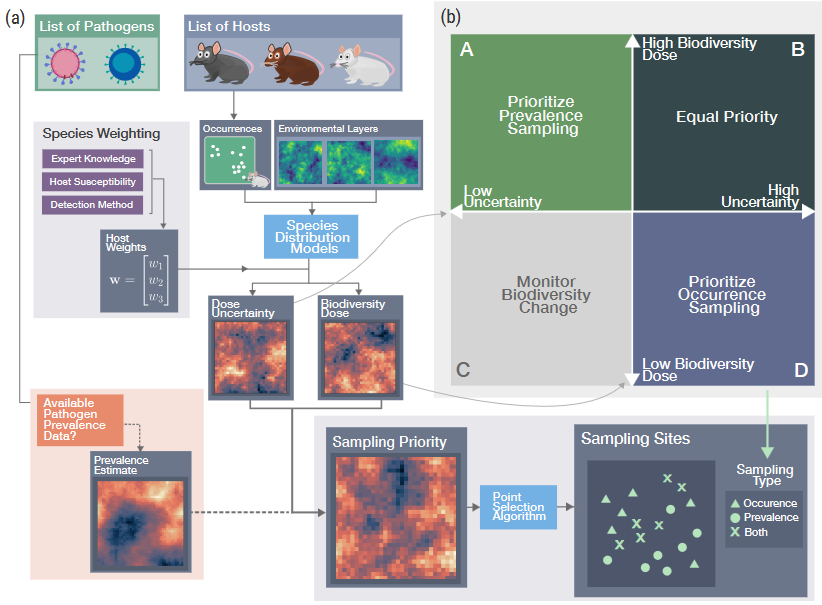
Framework for setting surveillance sampling priority. Host lists and occurrences feed species distribution models, giving a biodiversity dose and its uncertainty; these set a sampling priority and spatially balanced sampling sites, with the choice between prevalence and occurrence sampling set by dose and uncertainty.

Catchen et al. 2026, PLOS Ecosystems, 10.1371/journal.pesy.0000023.

Pest control as surveillance

  • ArHa is built from the literature, so it samples where researchers go. Swedish records are thin and come from research trapping, not from the places people meet rodents
  • Pest controllers and the public already record rodents in those places. A catch list is a hazard list: the traits that make a species a pest, fast breeding, a generalist diet and tolerance of people, are the traits that predict reservoir status
  • Next: bring pest-control and citizen-science records into ArHa’s structure of sampling events, host occurrences and pathogen results, giving a national infestation surface and a first urban rat pathogen baseline for Leptospira and Seoul orthohantavirus
  • Wider: ArHa grows beyond arenaviruses and hantaviruses to rodent-borne zoonoses, v1 gets updated, and what we learnt building it carries forward

CASCADE, funded by Formas, 2026; led by Hussein Khalil, SLU.

Use it

  • Open, versioned and citable: doi.org/10.5281/zenodo.21978982
  • Parquet tables for analysis, an explorer app for browsing
  • Non-detections and sampling effort included
  • Data paper in preparation, publicly available: link

Data get used in ways nobody planned

  • The Andes attribution drew on rodent surveys collected over decades, for other questions
  • Each of the 728 studies in ArHa was designed for its own question, not necessarily the ones we have used it for
  • Sharing openly is how that happens, rather than waiting for a collaboration request
  • Share yours in a shared format: the minimum data standard means the harmonisation is done once, at source

Pharos logo

Pharos hosts data in this format
pharos.viralemergence.org

Minimum data standard: Schwantes et al. 2025, Scientific Data, 10.1038/s41597-025-05332-x.

Thank you

The Project ArHa team

  • Steph Seifert
  • Ricardo Rivero
  • Grant Rickard
  • Harry Gordon
  • Ana Guiote
  • Greg Milne
  • Dave Redding

Funding

  • Verena consortium, Fellows‑in‑Residence programme
  • Sagan Friant and the SCAPES team, Penn State

Data

  • Every team whose study is in ArHa

David Simons, Uppsala University