| Species | Assay | References |
|---|---|---|
| Mastomys | ||
| Mastomys erythroleucus | PCR | Olayemi 2016b; Olayemi 2018; Adesina 2023; Bangura 2024; Oyeyiola 2025 |
| Mastomys erythroleucus | Serology | Fichet-Calvet 2014; Olayemi 2018; Bangura 2021; Oyeyiola 2025; Olayemi 2026 |
| Mastomys natalensis | Virus culture | Monath 1974; Wulff 1975 |
| Mastomys natalensis | PCR | Fichet-Calvet 2007; Fichet-Calvet 2008; Safronetz 2013; Kouadio 2015; Leski 2015; Fichet-Calvet 2016; Olayemi 2016a; Olayemi 2018; Mariën 2020; Bangura 2021; Adesina 2023; Bangura 2024; Oyeyiola 2025 |
| Mastomys natalensis | Serology | Coulibaly-N’Golo 2011; Safronetz 2013; Fichet-Calvet 2014; Olayemi 2018; Mariën 2020; Bangura 2021; Oyeyiola 2025 |
| Mus | ||
| Mus baoulei | PCR | Kronmann 2013; Anges 2019; Olayemi 2026 |
| Mus baoulei | Serology | Olayemi 2018; Olayemi 2026 |
| Mus cf. minutoides | Virus culture | Wulff 1975 |
| Mus minutoides | Serology | Coulibaly-N’Golo 2011; Fichet-Calvet 2014; Olayemi 2018 |
| Mus musculus | Serology | Saluzzo 1988; Olayemi 2026 |
| Mus setulosus | PCR | Coulibaly-N’Golo 2011 |
| Mus setulosus | Serology | Coulibaly-N’Golo 2011 |
| Rattus | ||
| Rattus rattus | Virus culture | Wulff 1975 |
| Rattus rattus | Serology | Olayemi 2018; Bangura 2021; Oyeyiola 2025 |
| Arvicanthis | ||
| Arvicanthis niloticus | Serology | Saluzzo 1988; Safronetz 2013 |
| Gerbilliscus | ||
| Gerbilliscus kempii | Serology | Saluzzo 1988 |
| Lophuromys | ||
| Lophuromys sikapusi | PCR | Bangura 2024 |
| Lophuromys sikapusi | Serology | Coulibaly-N’Golo 2011; Olayemi 2018; Bangura 2021 |
| Lemniscomys | ||
| Lemniscomys striatus | PCR | Olayemi 2026 |
| Lemniscomys striatus | Serology | Fichet-Calvet 2014; Olayemi 2026 |
| Praomys | ||
| Praomys daltoni | Serology | Fichet-Calvet 2014; Olayemi 2018; Oyeyiola 2025; Olayemi 2026 |
| Praomys misonnei | Serology | Olayemi 2018 |
| Praomys rostratus | Serology | Fichet-Calvet 2014; Bangura 2021 |
| Hylomyscus | ||
| Hylomyscus pamfi | PCR | Olayemi 2016b; Olayemi 2018 |
| Hylomyscus pamfi | Serology | Olayemi 2018; Oyeyiola 2025 |
| Malacomys | ||
| Malacomys edwardsi | Serology | Bangura 2021 |
Lassa epidemiology
Case burden, reporting and the limits of the sampling record
Lassa Fever
Epidemiology
How many Lassa fever cases there really are, and what the surveillance and sequence record can support.
Reported Lassa fever case counts feed almost every risk model, yet they are incomplete in ways that vary by country and by year. This programme assesses what can be inferred from the surveillance, sampling and sequence record as it stands: which hosts carry the virus, how far human cases are under-reported, and what a change in a reported indicator can and cannot show.
17 small mammal species with Lassa virus detections
2.6 million estimated Lassa virus infections a year
10 countries in the confirmed case record
Detections in hosts
Small mammal species in which Mammarenavirus lassaense has been detected in West Africa, by assay, with the studies that report each detection. The records come from the Project ArHa database, reviewed and extended to 2026.
Reported human cases
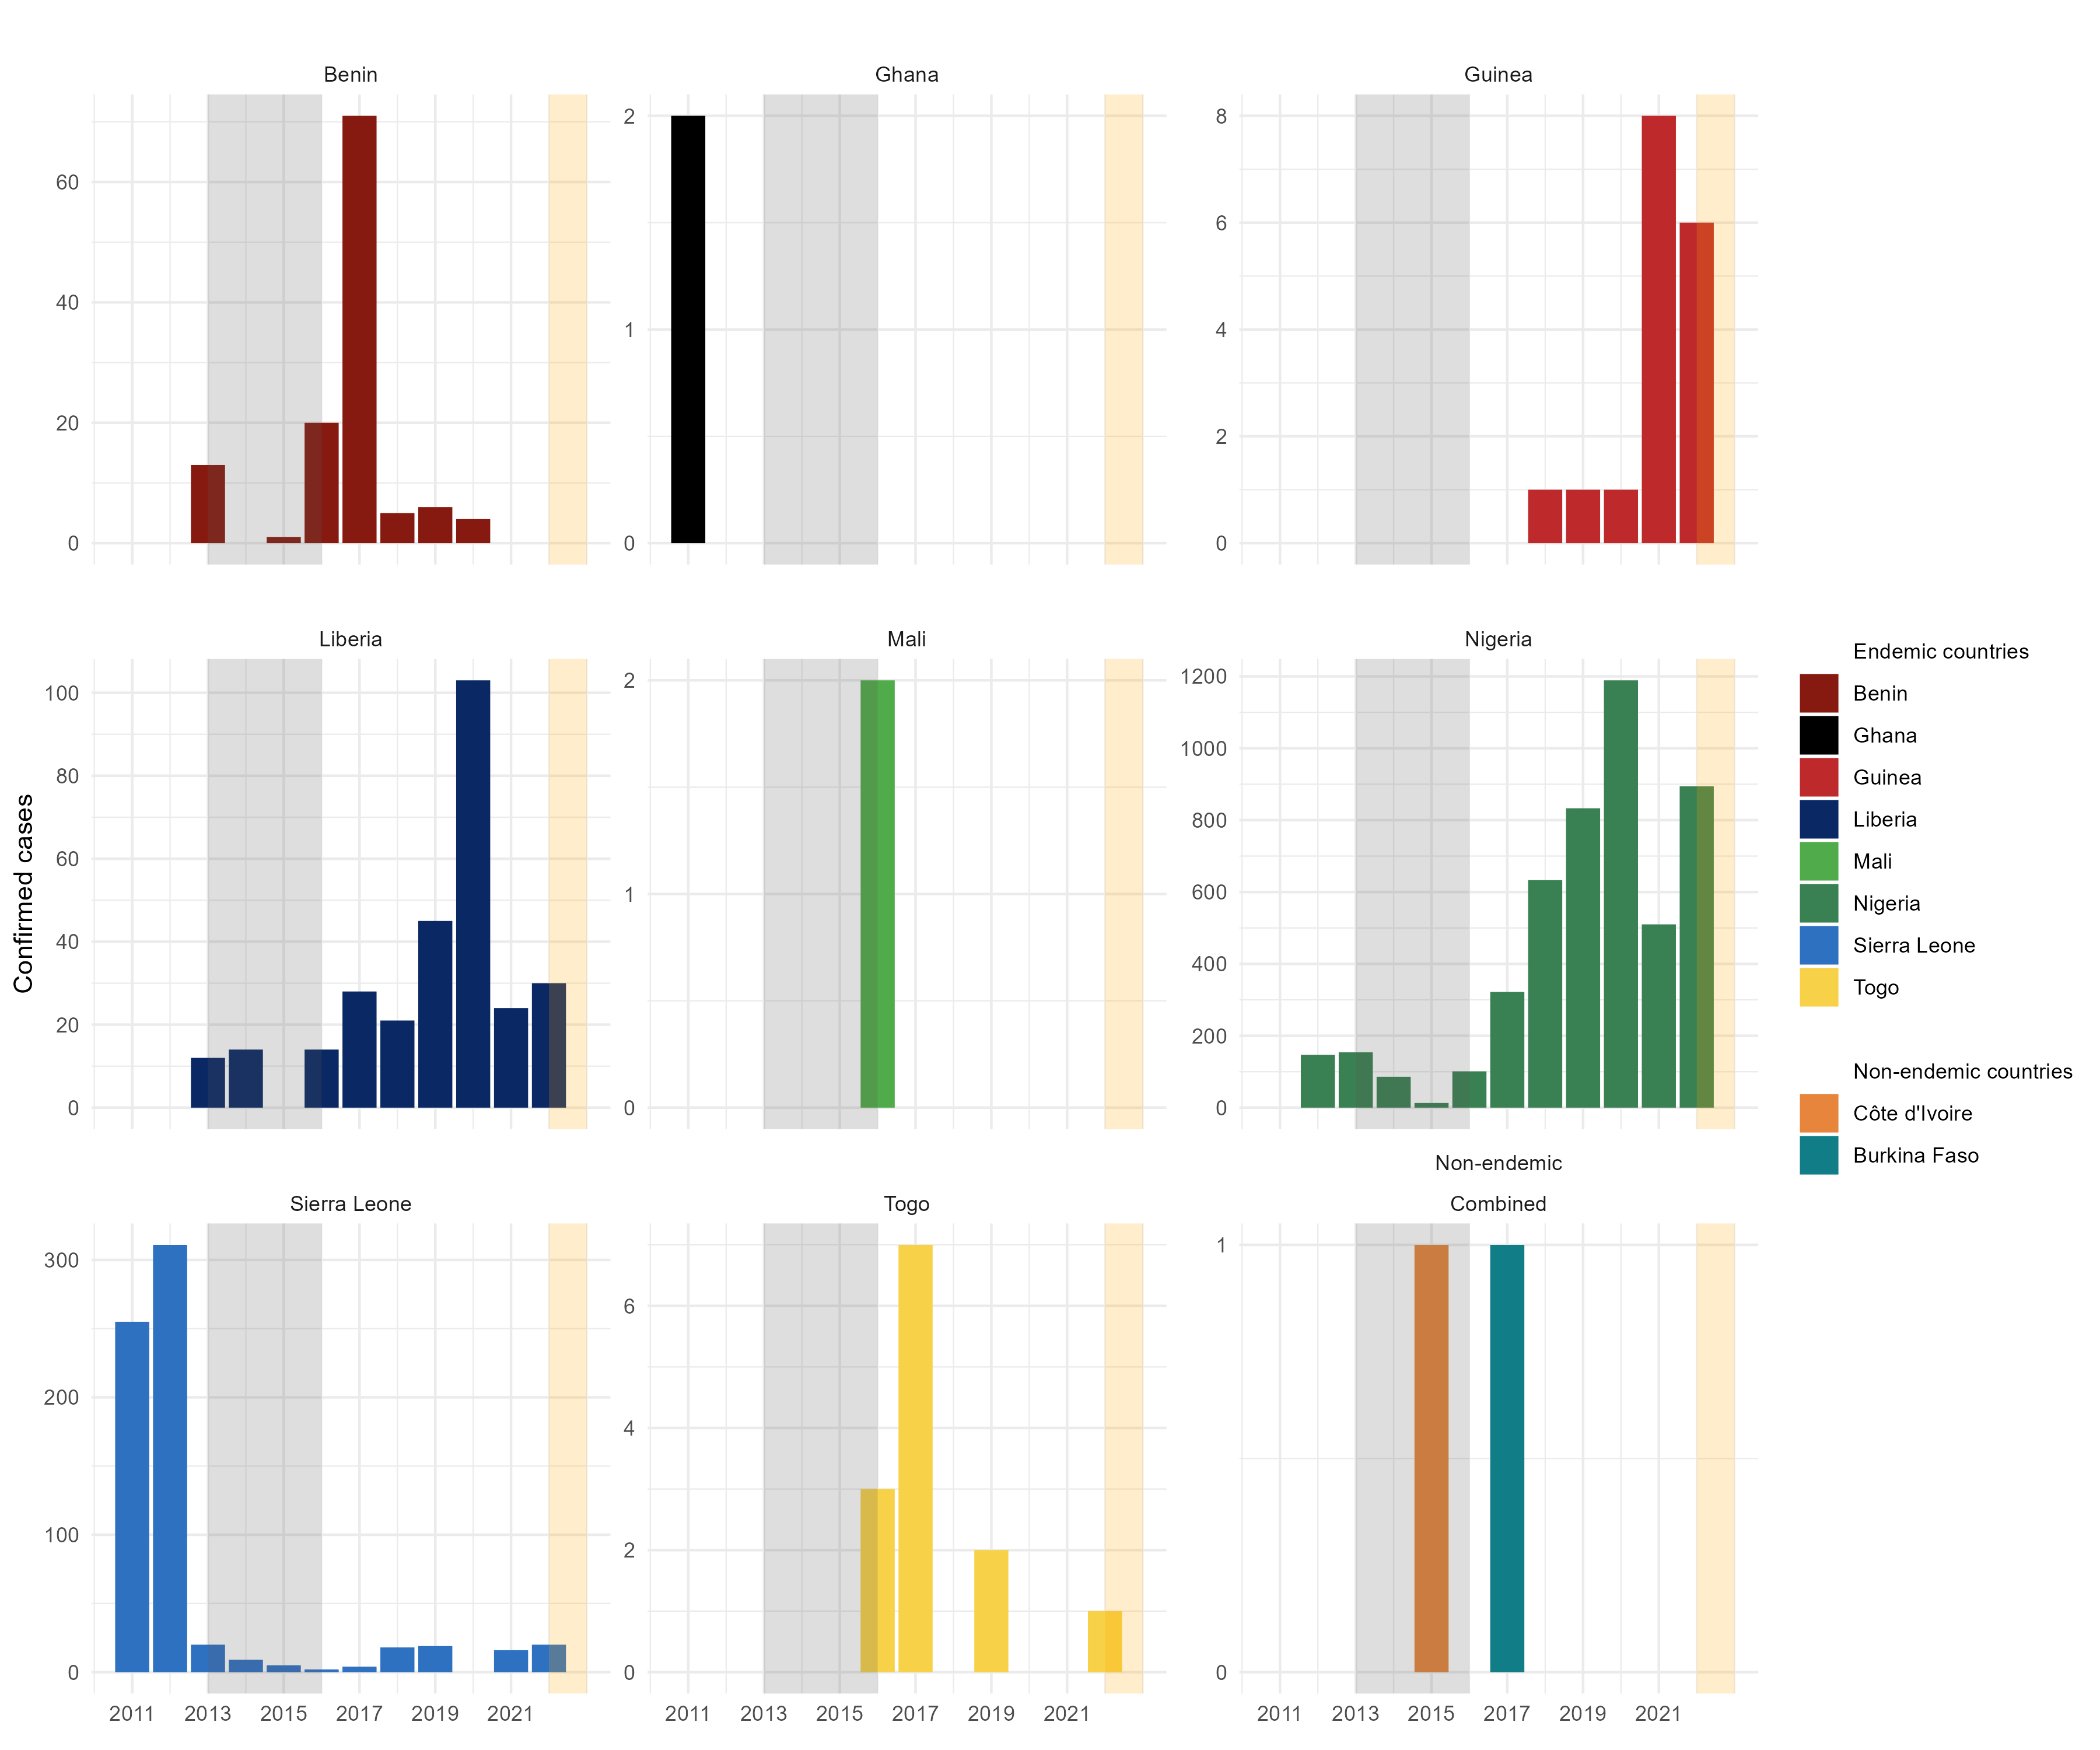
Confirmed Lassa fever cases by country and year. Nigeria publishes weekly situation reports, so its series is complete from 2016 and current to the latest report. Figures for the other countries are compiled by hand from WHO, ECDC, ProMED, national reports and publications, and are often partial. Each panel gives the latest year with data. Newer figures or corrections are welcome.
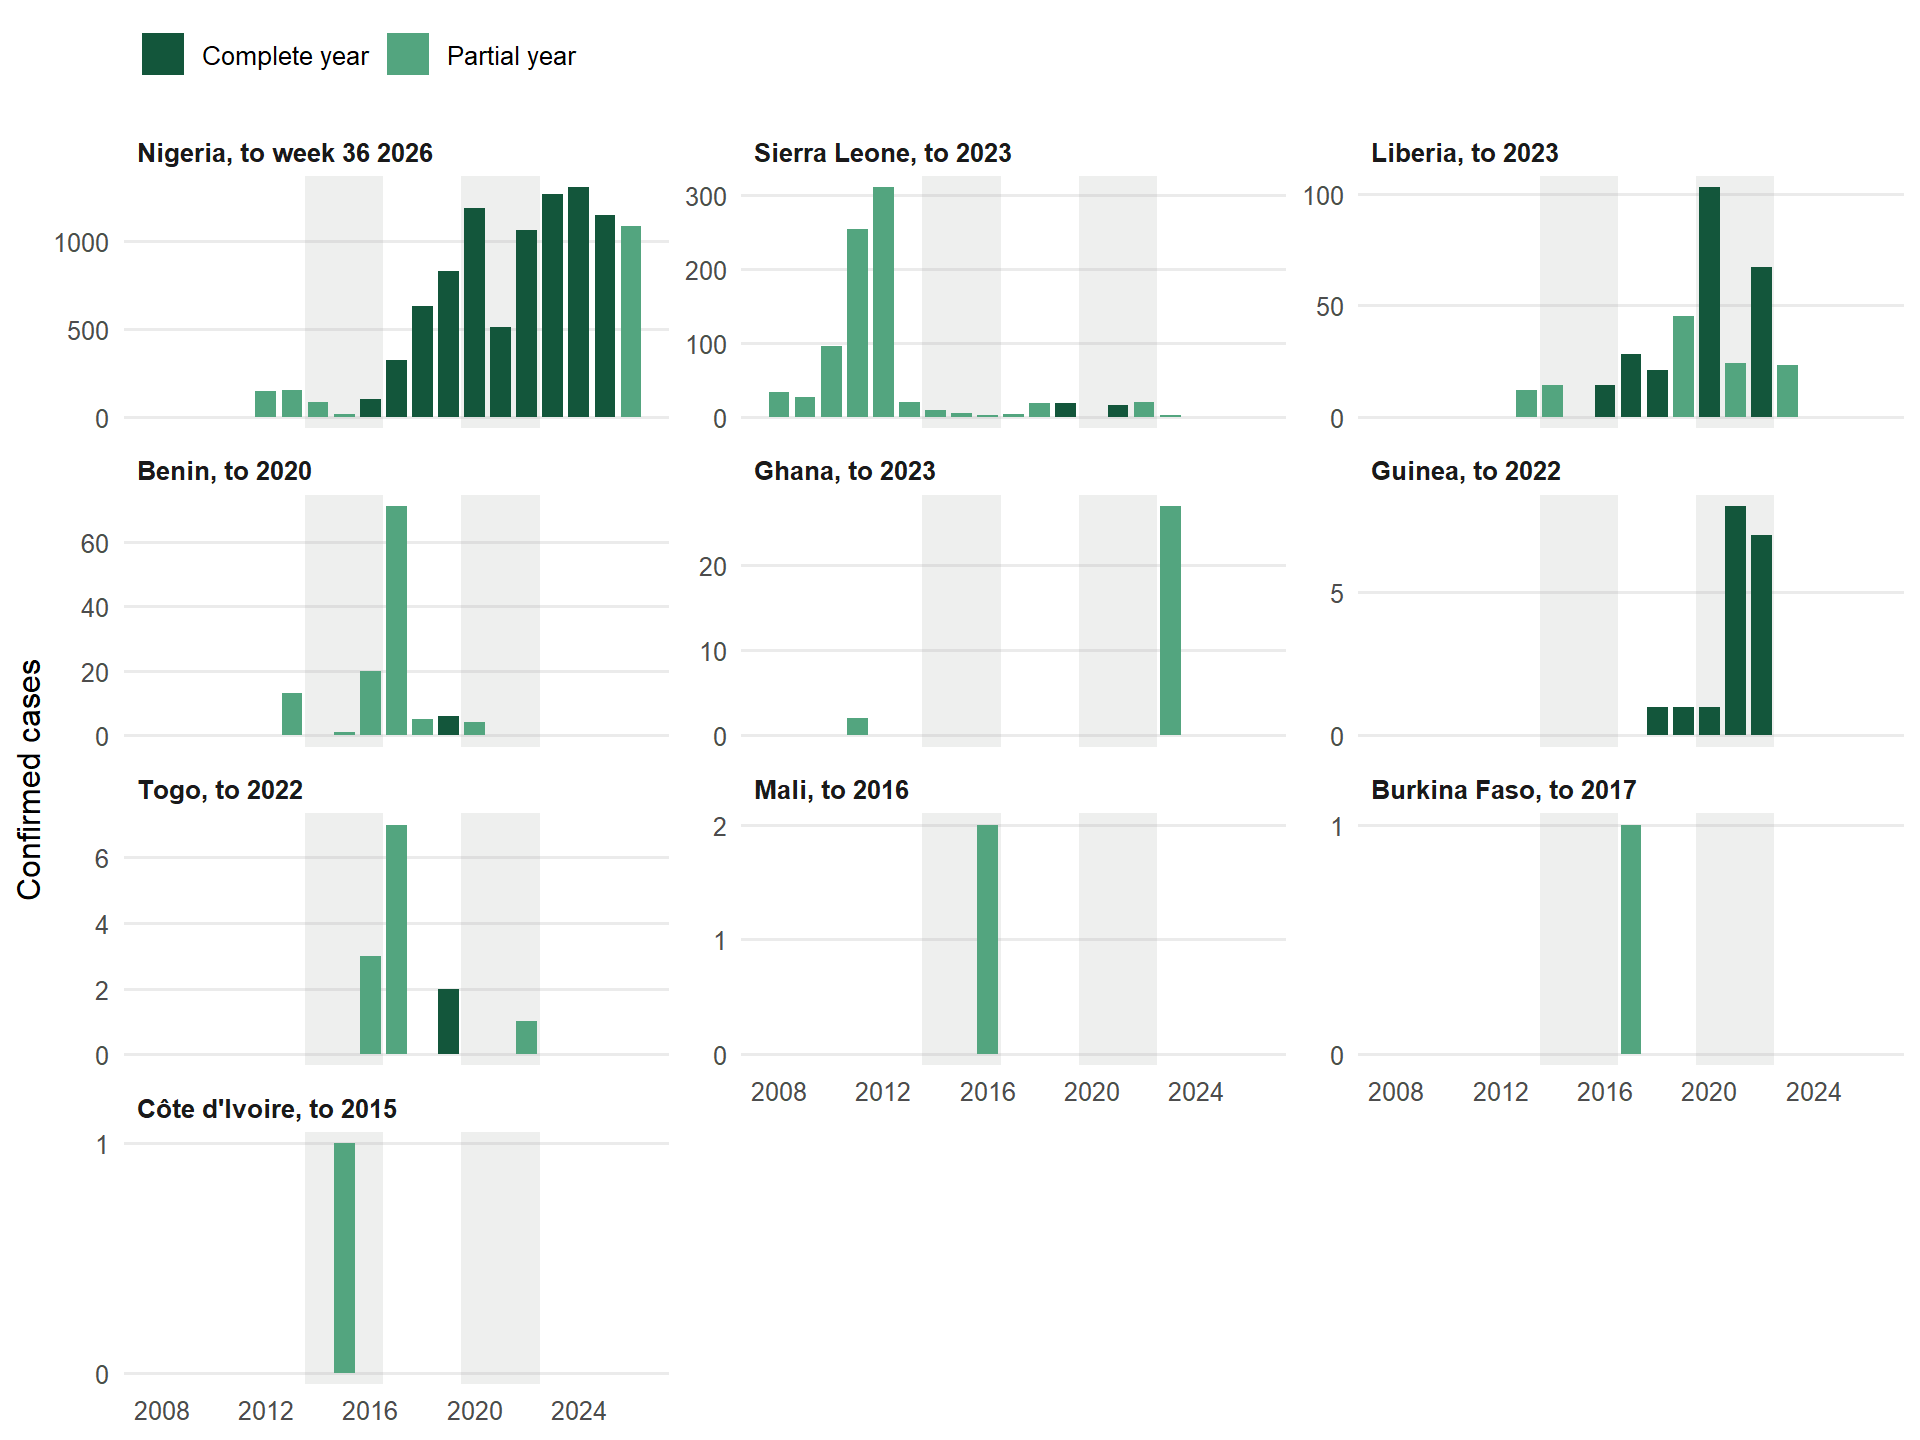
Grey bands mark the West African Ebola epidemic (2014 to 2016) and the COVID-19 pandemic (2020 to 2022), both of which disrupted surveillance. Download the data (CSV), with the source of every value.
Show sources by country
| Country | Years | Country-years | Sources |
|---|---|---|---|
| Nigeria | 2012 to 2026 | 15 | Data table, NCDC situation report, ProMED, Situation report |
| Sierra Leone | 2008 to 2023 | 15 | ProMED, Publication, WHO |
| Liberia | 2013 to 2023 | 10 | ProMED, Publication, WHO |
| Benin | 2013 to 2020 | 7 | ProMED, Publication, WHO |
| Ghana | 2011 to 2023 | 2 | Publication, WHO |
| Guinea | 2018 to 2022 | 5 | ProMED, Publication, WHO |
| Togo | 2016 to 2022 | 4 | ECDC, ProMED, WHO |
| Mali | 2016 to 2016 | 1 | Publication |
| Burkina Faso | 2017 to 2017 | 1 | ProMED |
| Côte d’Ivoire | 2015 to 2015 | 1 | Publication |
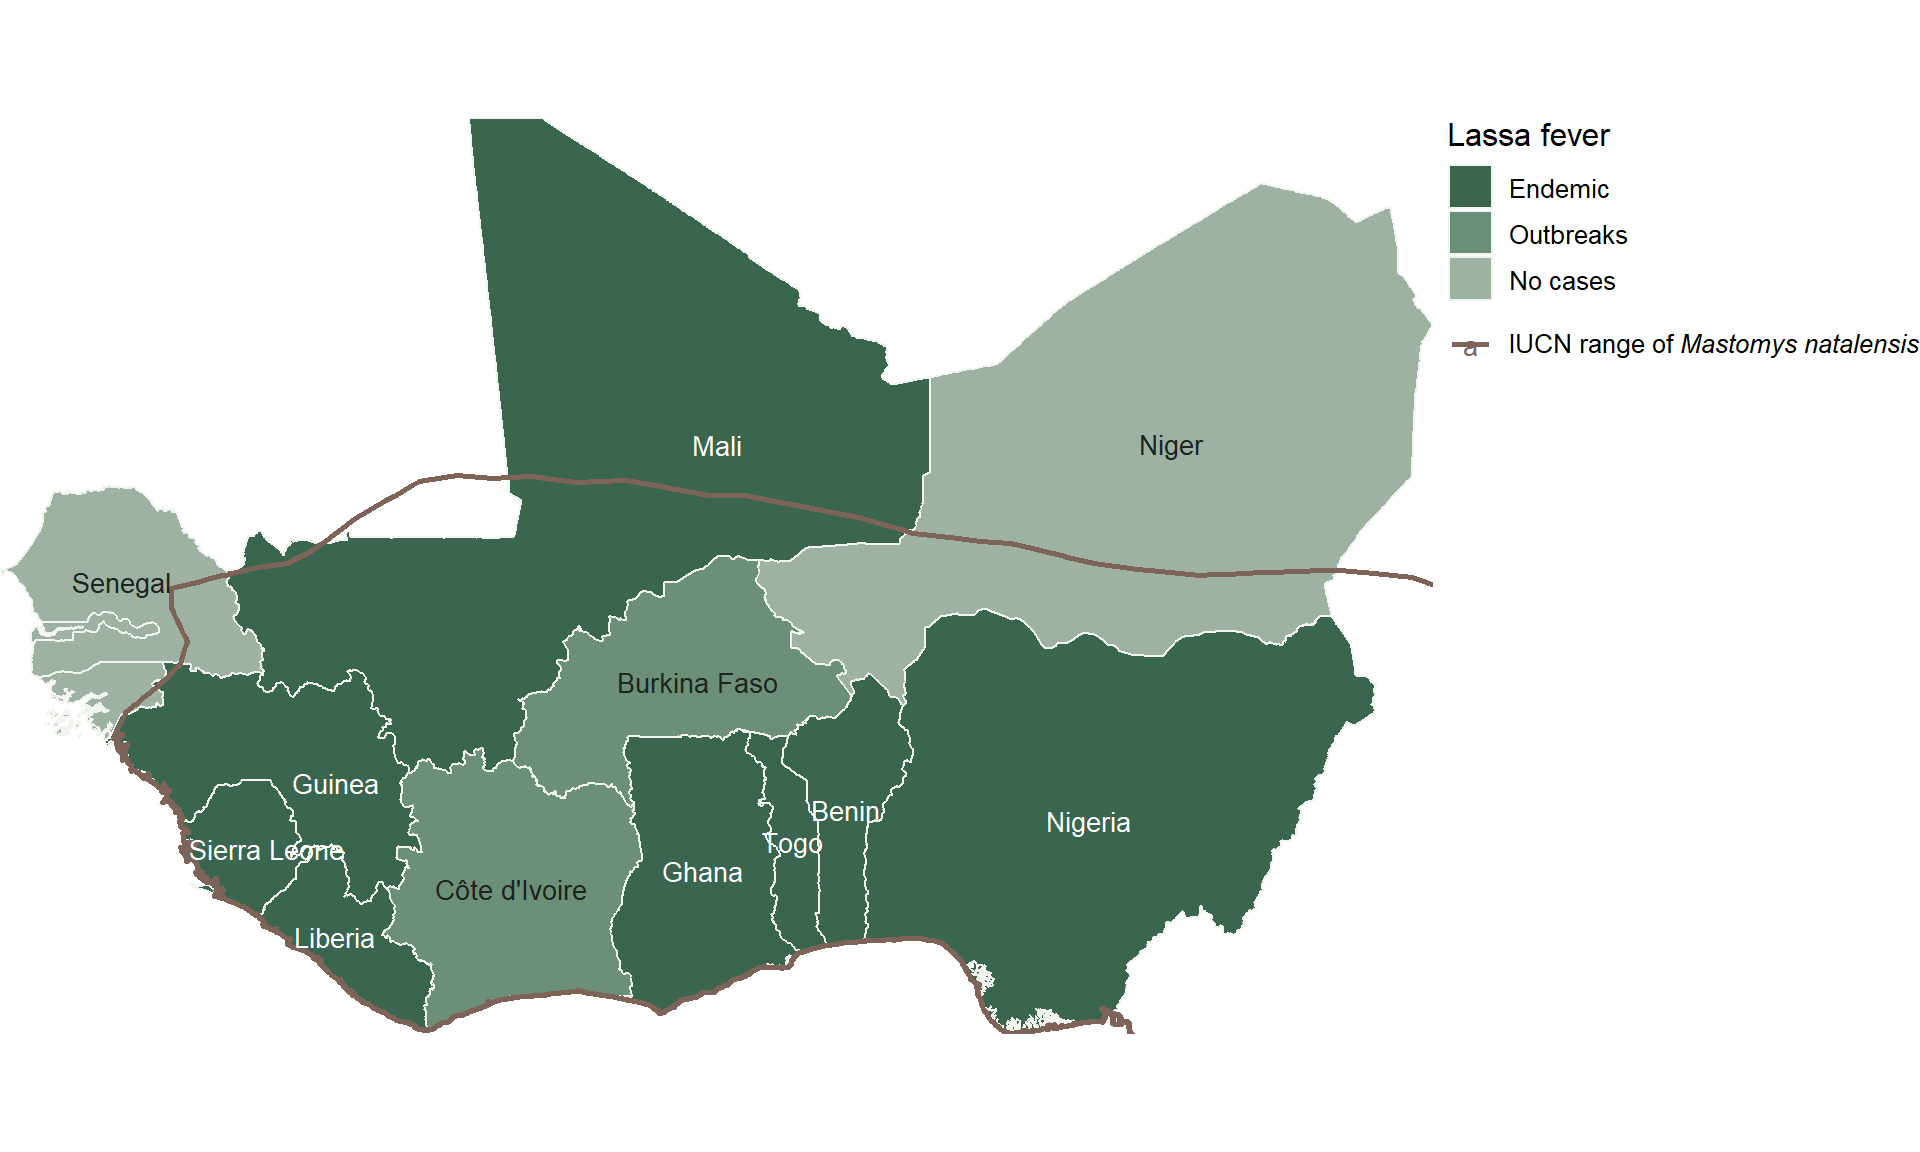
Countries by Lassa fever status, with the IUCN range of Mastomys natalensis, the main reservoir, outlined.
Estimated burden
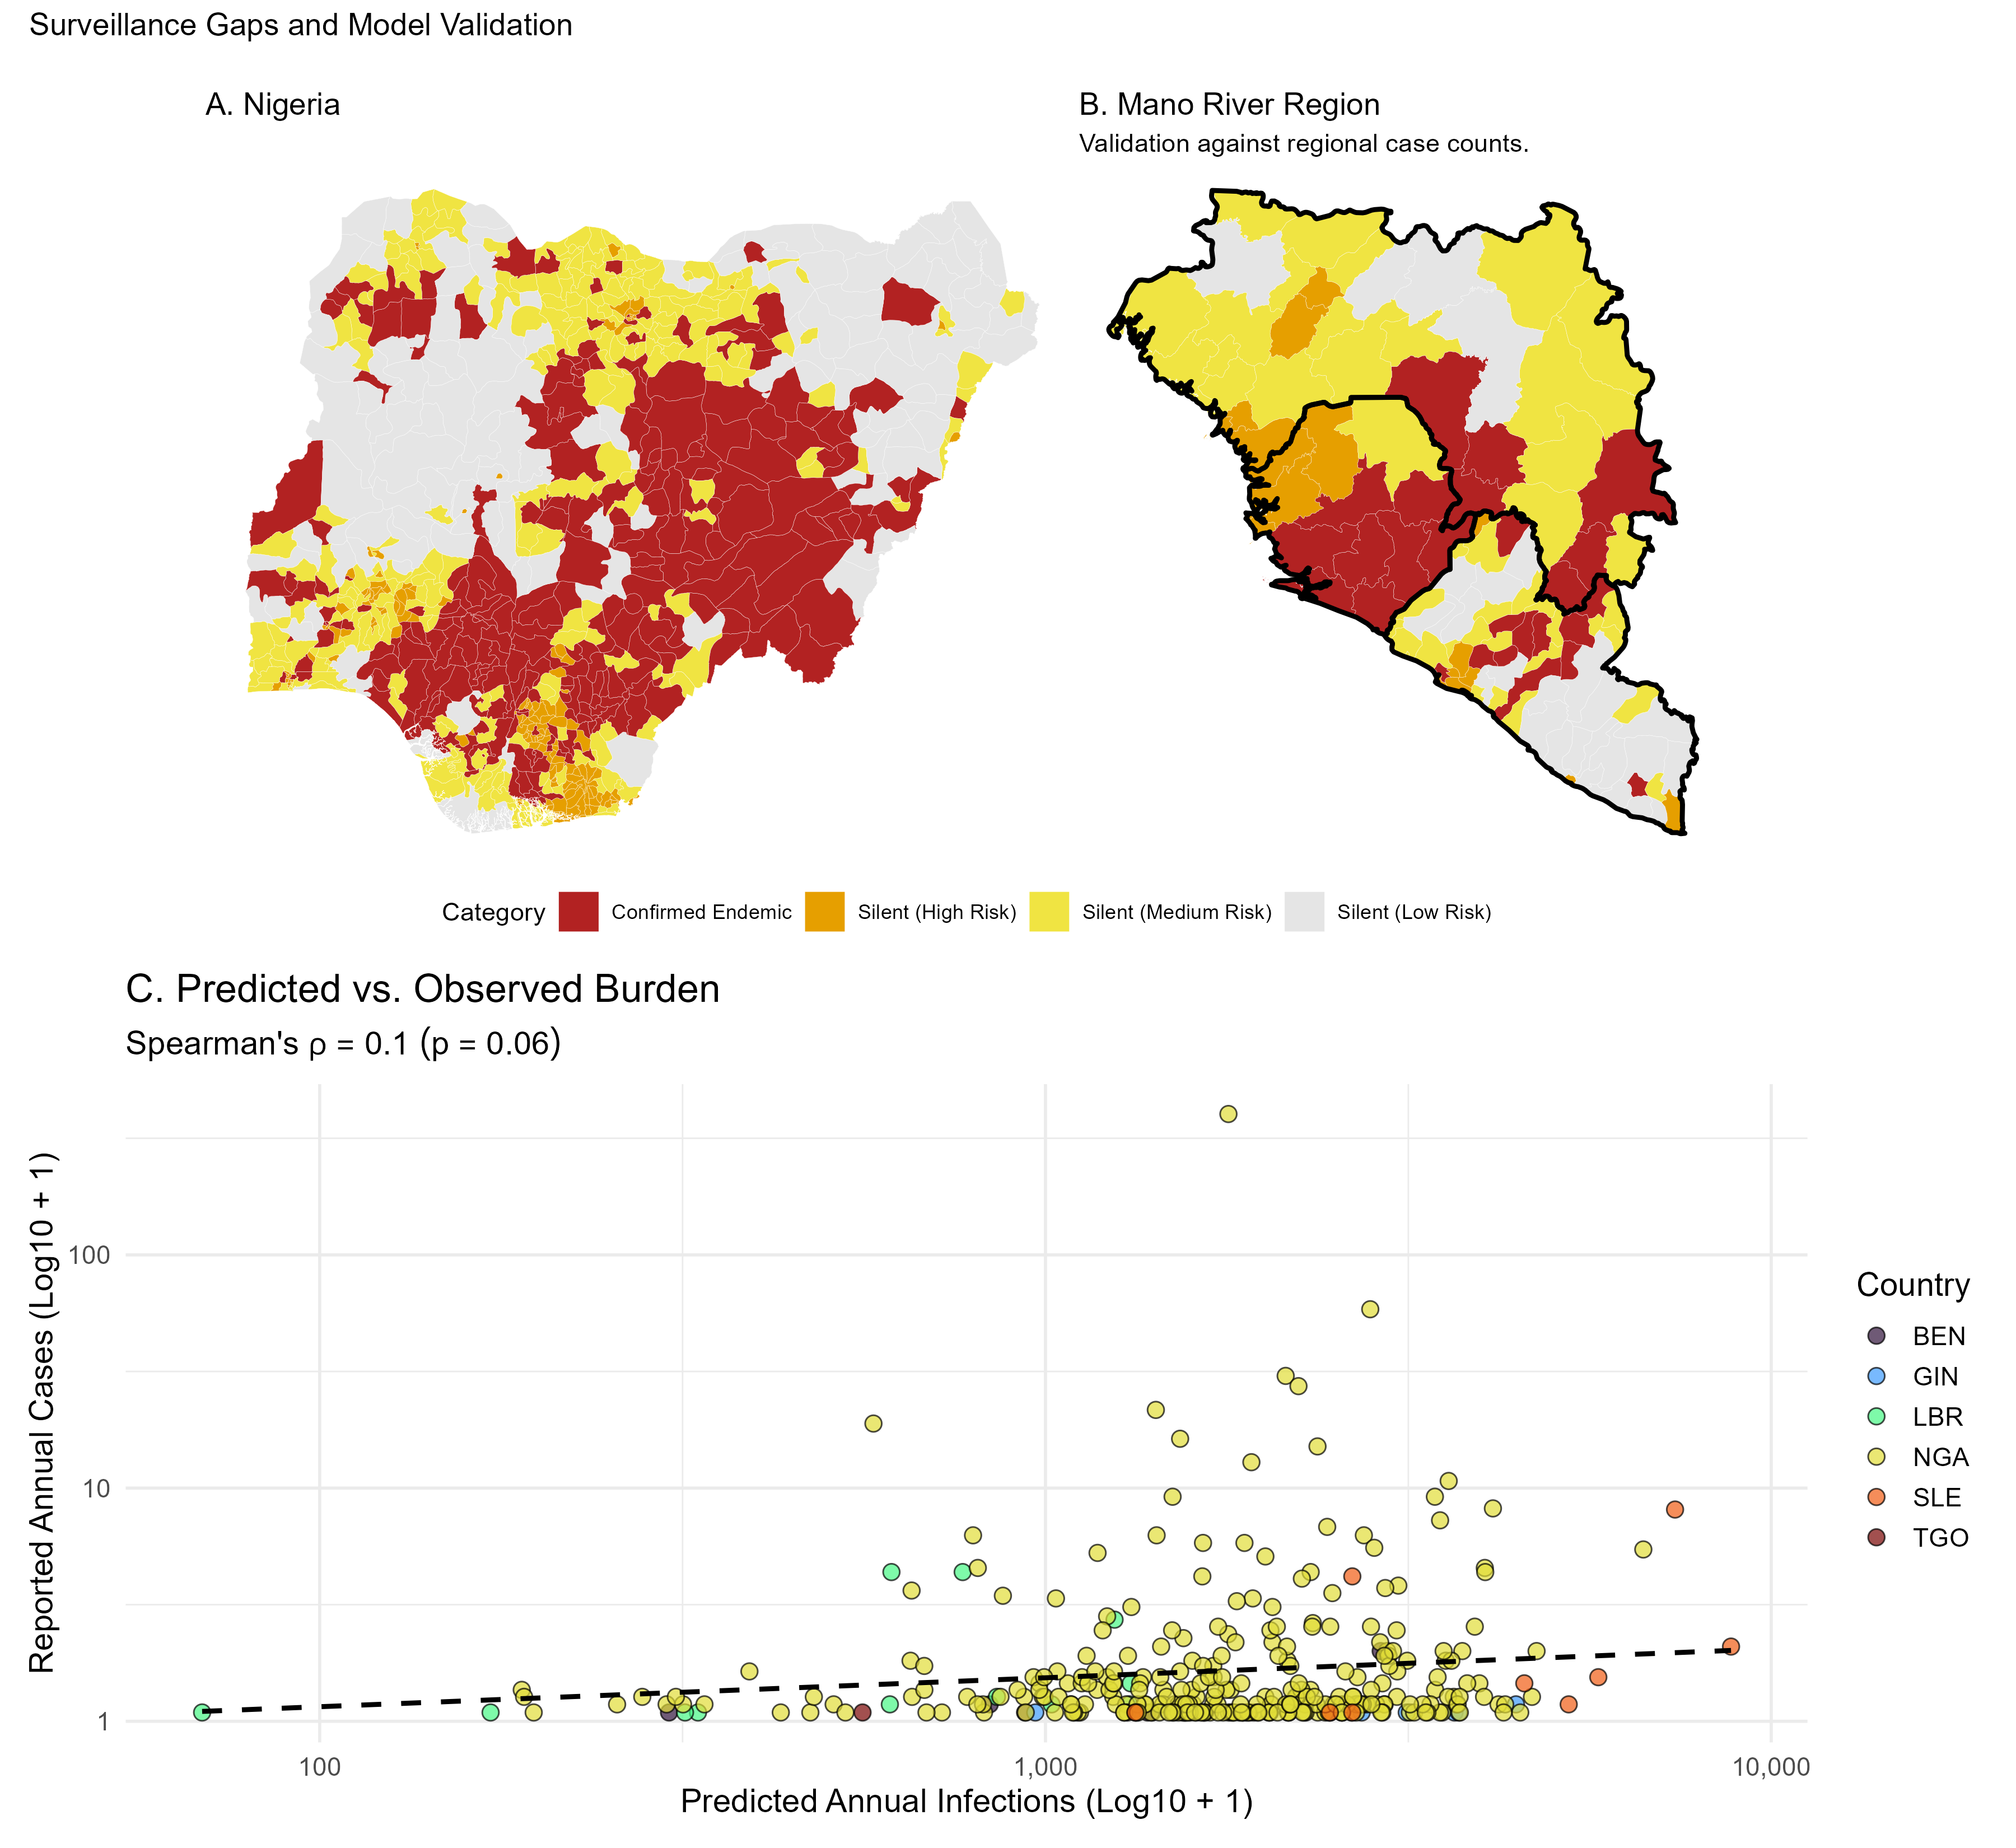
Reported cases are a small fraction of infections. The socio-economic shield paper estimates the regional burden from where the reservoir persists, including at the urban fringe, and how urban infrastructure dampens spillover. After adjusting for seroreversion and shielding, it estimates about 2.6 million Lassa virus infections a year across the endemic region. It also identifies districts in Nigeria, Benin and Togo with high predicted infection and no reported cases.
Ongoing work
Reported Lassa fever case fatality in Nigeria, 2017–2026
Analysis plan, 2026 · Code on GitHub
Summary
The Nigeria Centre for Disease Control and Prevention reports a case fatality rate among laboratory-confirmed Lassa fever cases in every weekly situation report. A reported case fatality rate is a ratio of two surveillance counts, so it can change through who is tested, which deaths are found, where cases occur and when the figure is read, as well as through a change in the risk of death.
The study sets out these mechanisms, assesses which of them the published situation reports from 2017 to 2026 allow to be evaluated, and evaluates those that can be. The analysis plan was fixed and archived before the analyses were run on the final data. No results are available yet.
Lassa fever
Simons D, Bangura U, Fichet-Calvet E, Asogun D, Friant S
Chapter 1.29 in Kock R (ed.), Zoonoses and Zoonotic Diseases: A Comprehensive Reference, Elsevier. Forthcoming.
A One Health review of the virus, its reservoir, epidemiology, clinical disease, diagnosis and treatment, and the integrated strategies needed for its control.
Data and code
- Under-reporting. Code and data for the estimate of under-reported cases from reported deaths are on GitHub.
- Hosts and cases. The host detections and confirmed cases behind the table and figure on this page.
Papers
The socio-economic shield limits Lassa virus spillover in urban West Africa
Simons D
Preprint, 2025 · Epidemiology and Infection, 2026 · PDF
Summary
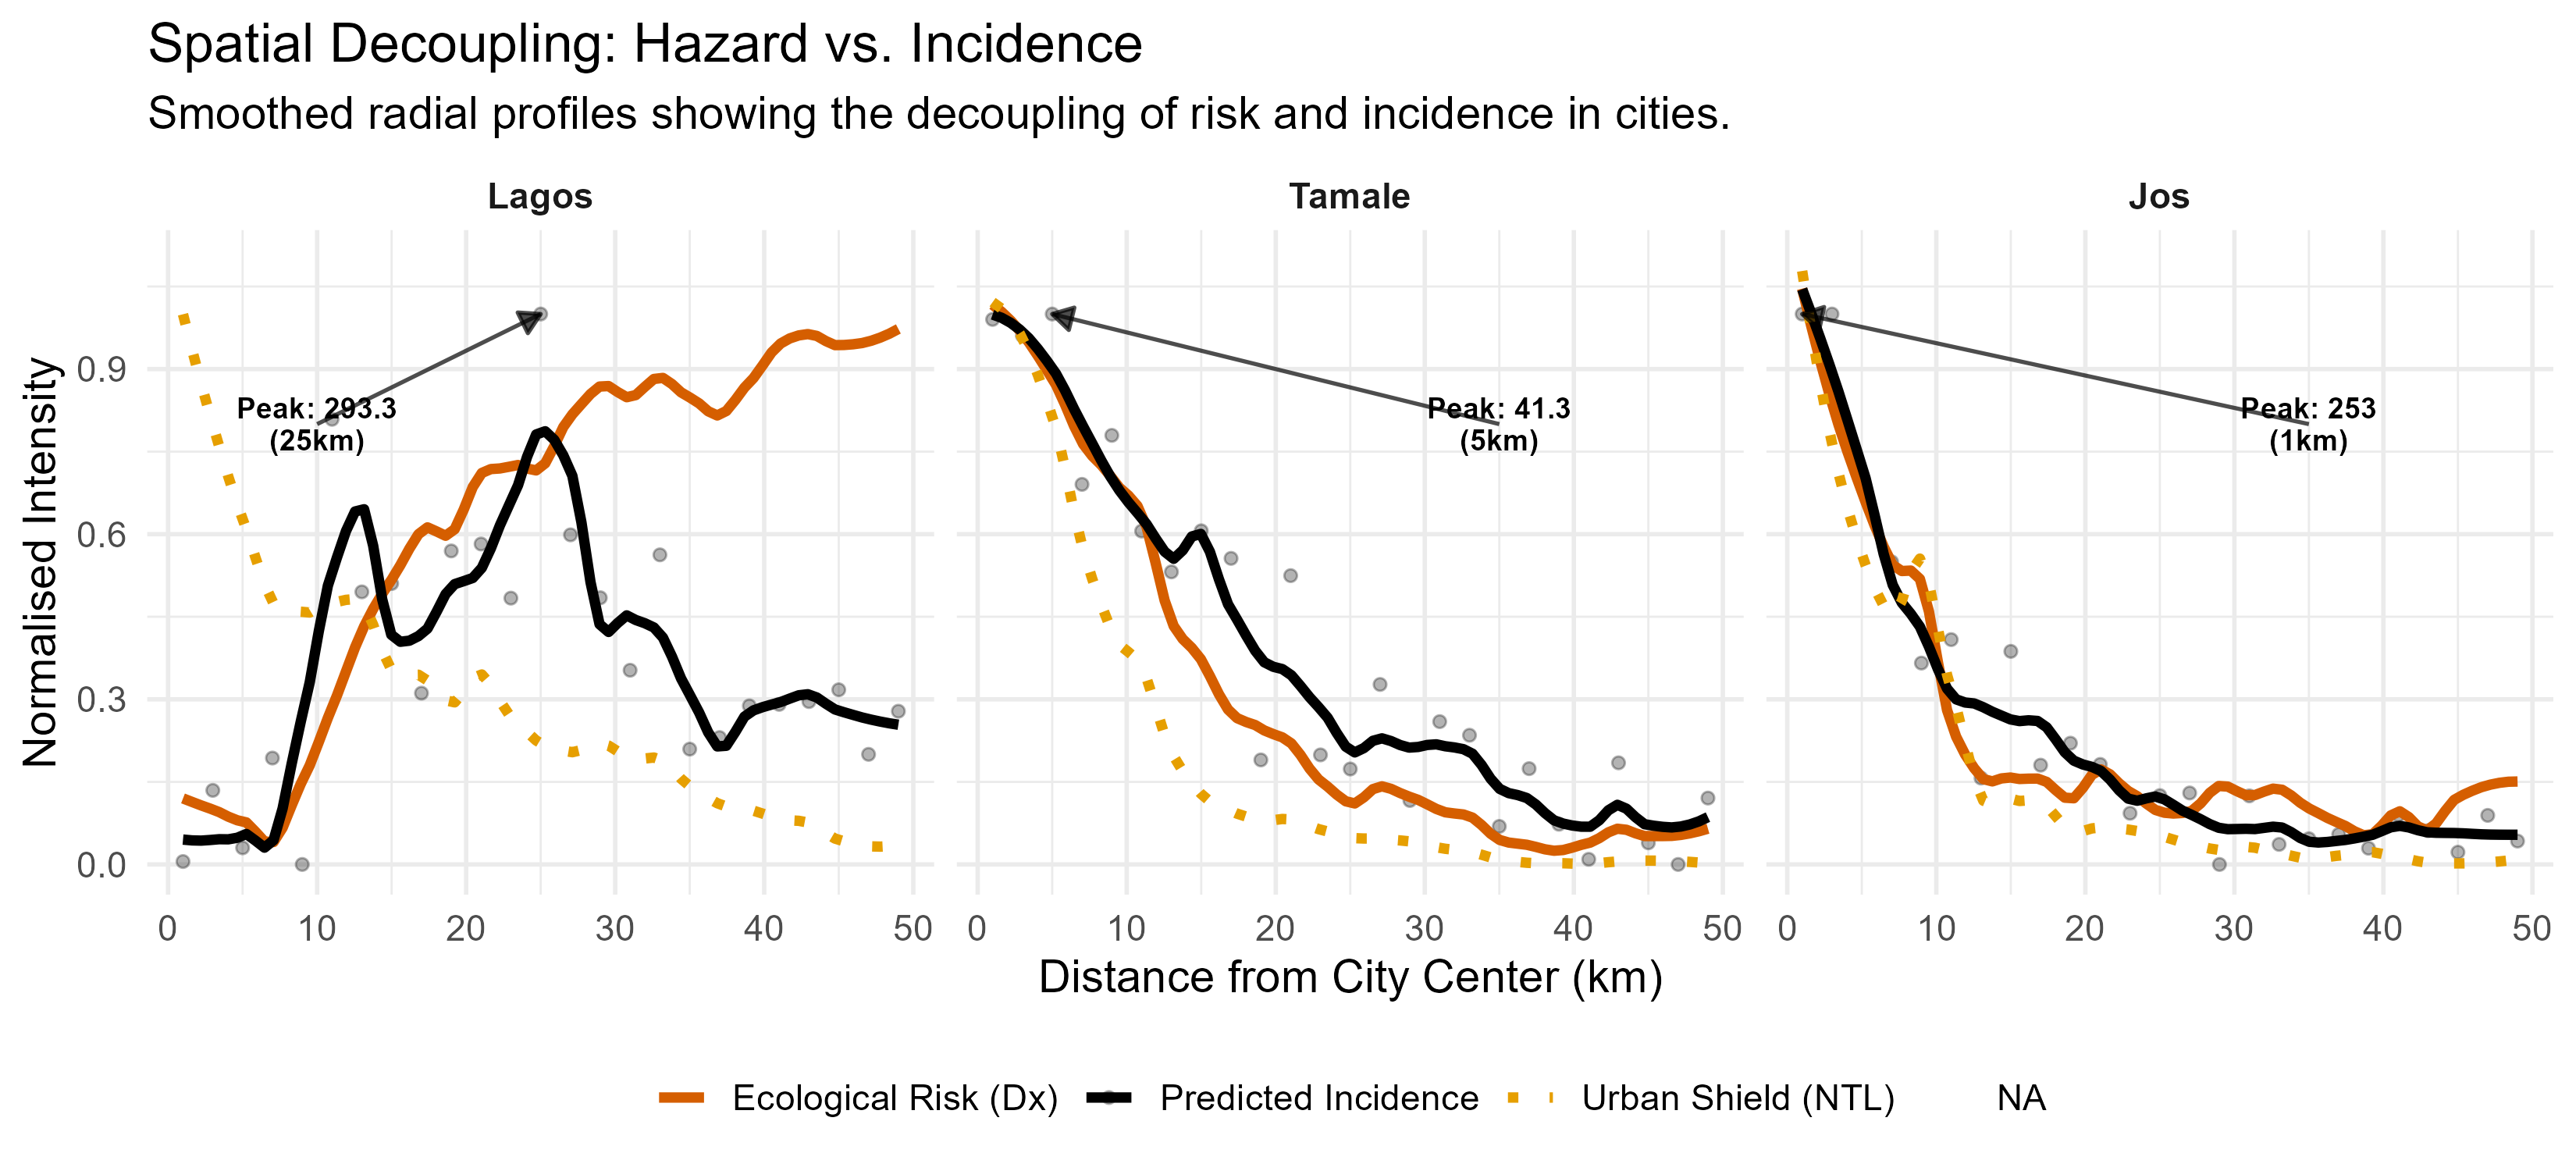
Spatial models of Lassa fever risk have relied on abiotic climatic envelopes for the reservoir host, the natal multimammate mouse Mastomys natalensis, and so predict a rural disease. This paper assesses what changes when biotic interactions and anthropogenic land use are added to the reservoir’s realised niche.
An integrated multi-species occupancy model quantifies co-occurrence between M. natalensis and the invasive commensals Rattus rattus and Mus musculus. With those interactions in the model, M. natalensis persists in peri-urban and human-modified landscapes rather than being competitively excluded, so ecological hazard extends to the urban fringe.
Realised spillover is then modelled with a socio-economic shield, proxied by night-time lights, that dampens transmission non-linearly with urban infrastructure. Hazard and incidence decouple across the city profile. Adjusting for seroreversion and shielding gives a regional burden near 2.6 million infections a year. Validation against clinical data identifies high-suitability districts in Nigeria, Benin and Togo that report no cases, surveillance gaps produced by structural inequality rather than by absence of hazard.
Current sampling and sequencing biases of Lassa mammarenavirus limit inference from phylogeography and molecular epidemiology in Lassa fever endemic regions
Arruda LB, Free HB, Simons D, Ansumana R, Elton L, Haider N, et al.
Preprint, 2023 · PLOS Global Public Health, 2023 · PDF
Summary
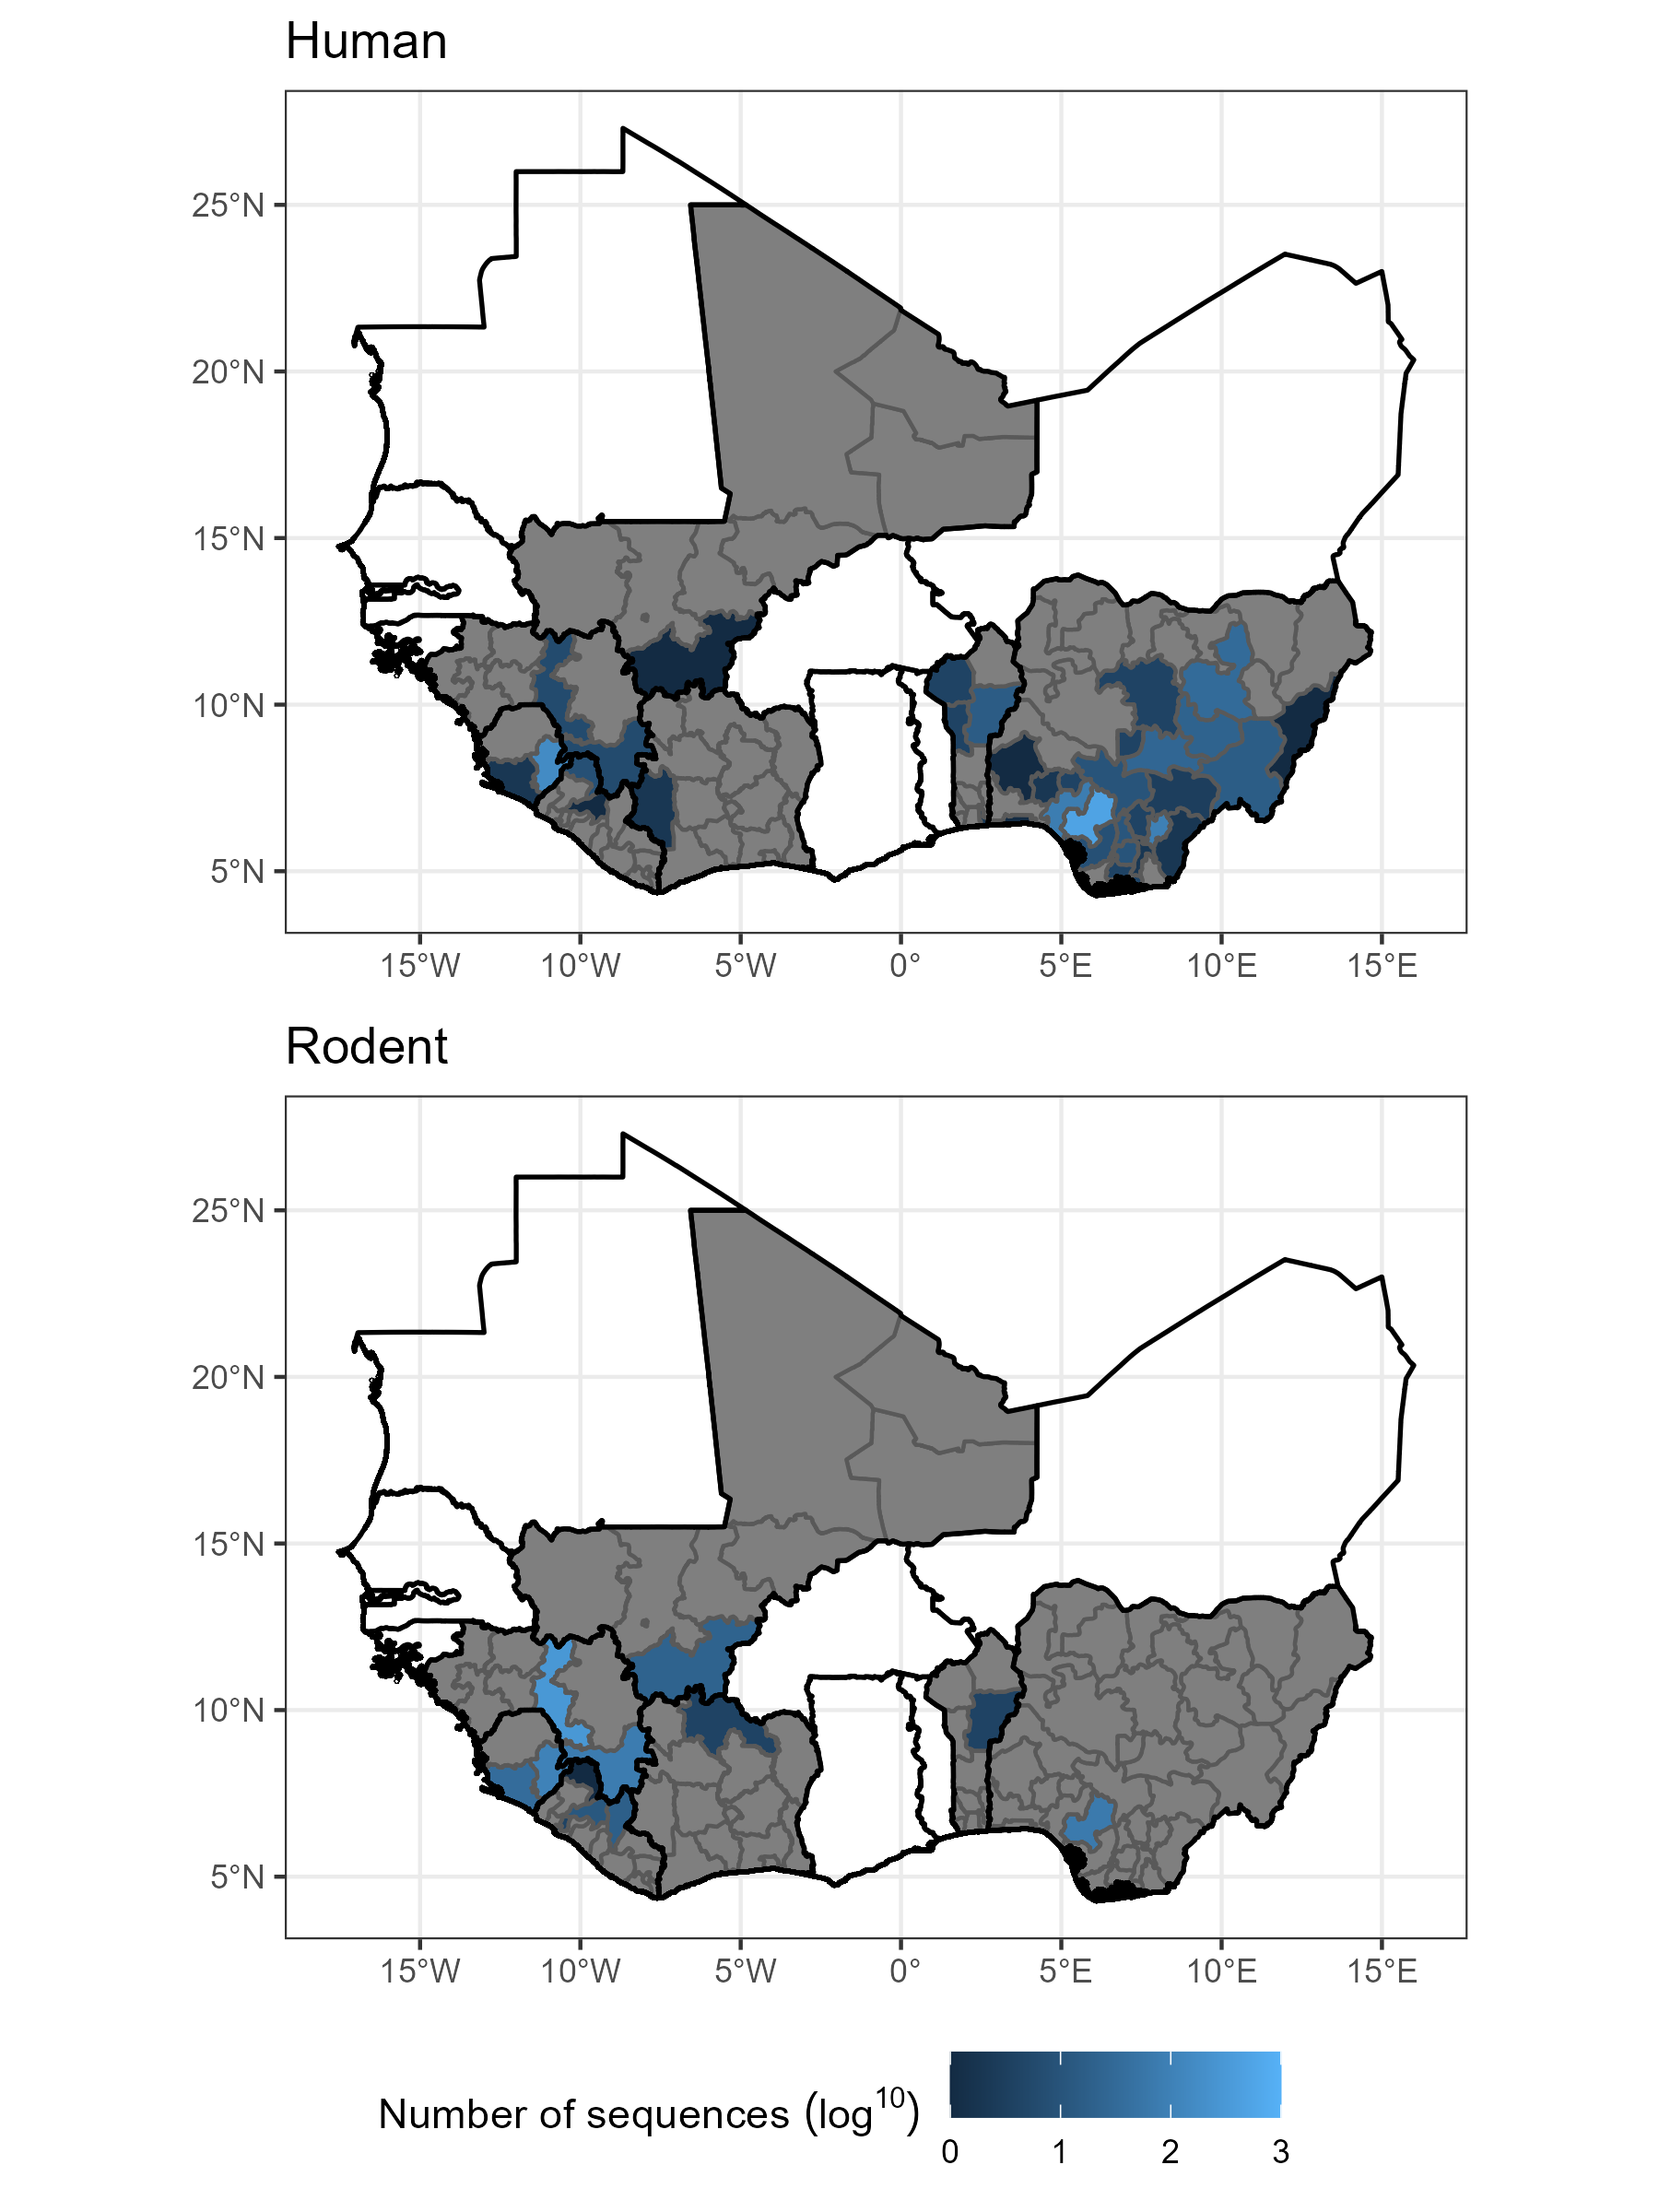
Phylogeographic and molecular epidemiological analyses have been used to project expansion of the Lassa fever endemic zone under global change. Such projections inherit whatever spatial and host bias exists in the underlying sequence data, which had not been quantified.
All Lassa mammarenavirus nucleotide sequences with associated metadata were retrieved from GenBank (n = 2,298) and their provenance characterised by host and location. Sampling is strongly heterogeneous, and the human and rodent sequence sets come from different places. Most human-derived sequences originate from two states in southern Nigeria; most rodent-derived sequences come from Guinea and eastern Sierra Leone, with few from Nigeria. Host species other than Mastomys natalensis are barely represented.
Because the two data streams scarcely overlap geographically, combining them for phylogeographic reconstruction risks attributing sampling structure to viral movement. Inference about endemic zone expansion should be reported against this sampling frame rather than independently of it.
Lassa fever cases suffer from severe underreporting based on reported fatalities
Simons D
Preprint, 2022 · International Health, 2022 · PDF (preprint)
Summary
The burden of Lassa fever is unknown. Diagnostic capacity and healthcare access are limited across the endemic region, and widely cited estimates derive from work in the 1970s and 1980s that has not been revised for population growth or for changes in surveillance.
This analysis approaches the problem through case fatality, assuming deaths are ascertained more completely than cases. A dataset of 38 records covering 5,230 reported cases and 1,482 reported deaths from seven countries was assembled from ProMED, WHO bulletins, Nigeria Centre for Disease Control situation reports and the literature. Weighted mean case fatality was estimated under three subsets, giving 16.5% to 25.6%. The estimate restricted to Edo and Ondo states, where diagnostic access is greatest, is taken as closest to the true value among severe cases.
Applying that rate implies 8,995 expected severe cases between 2012 and 2022, against which reported numbers represent 58%. The assumptions are strong and stated explicitly, so the estimate is crude, but it bounds the systematic under-ascertainment that citation of reported case counts obscures.
Last updated 5 October 2026