Open tools and data
Applications and standards for other people’s fieldwork
A surprising amount of what field epidemiology needs is locked in a PDF, chosen by convenience, or never recorded at all. These tools and standards each fix one instance of that. All are open source.
Applications
The applications run on a free hosting tier and go to sleep when unused, so the first load can take up to a minute. Each one’s source is on GitHub if the hosted version is unavailable.
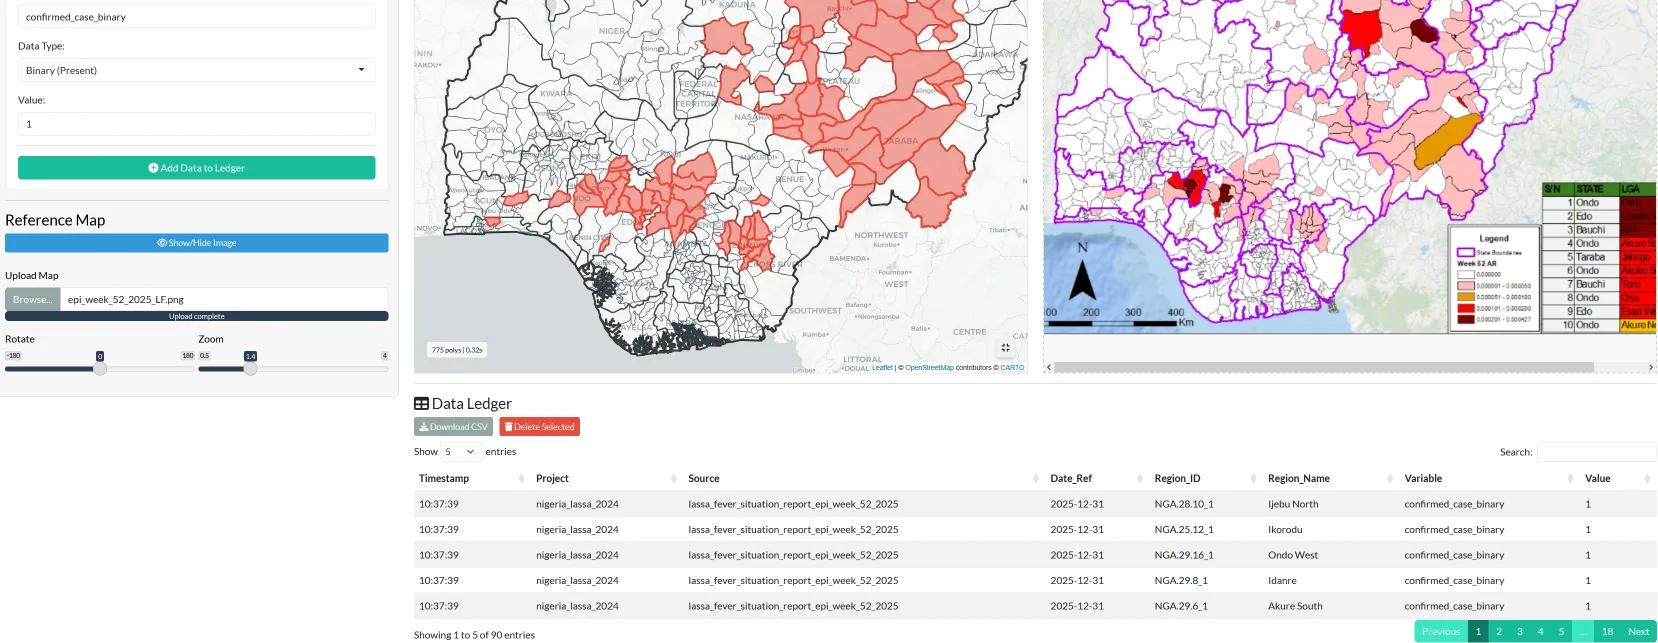
Map Liberator
Recovers sub-national data from static maps, such as those in PDF situation reports, by assigning values to official administrative boundaries and exporting a table ready for analysis.
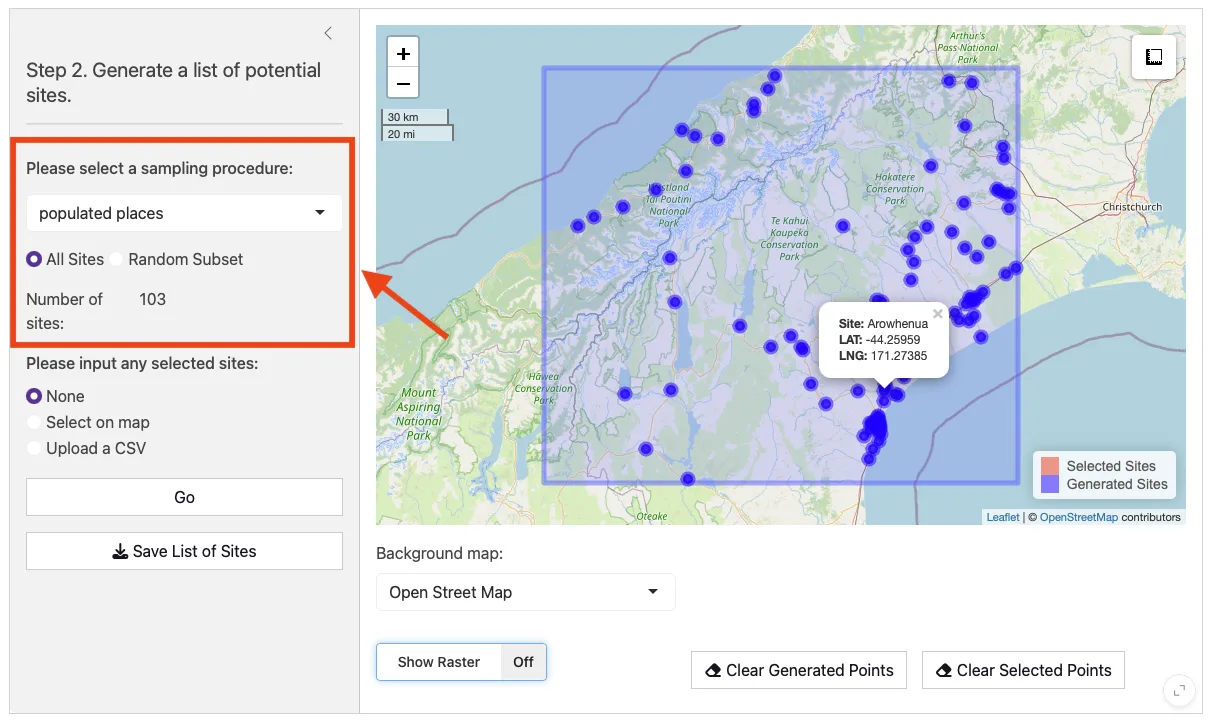
SiteTool
Generates candidate field sites within a study area and tests a chosen set for environmental bias before fieldwork begins. It structured the sampling frame for SCAPES in Nigeria.
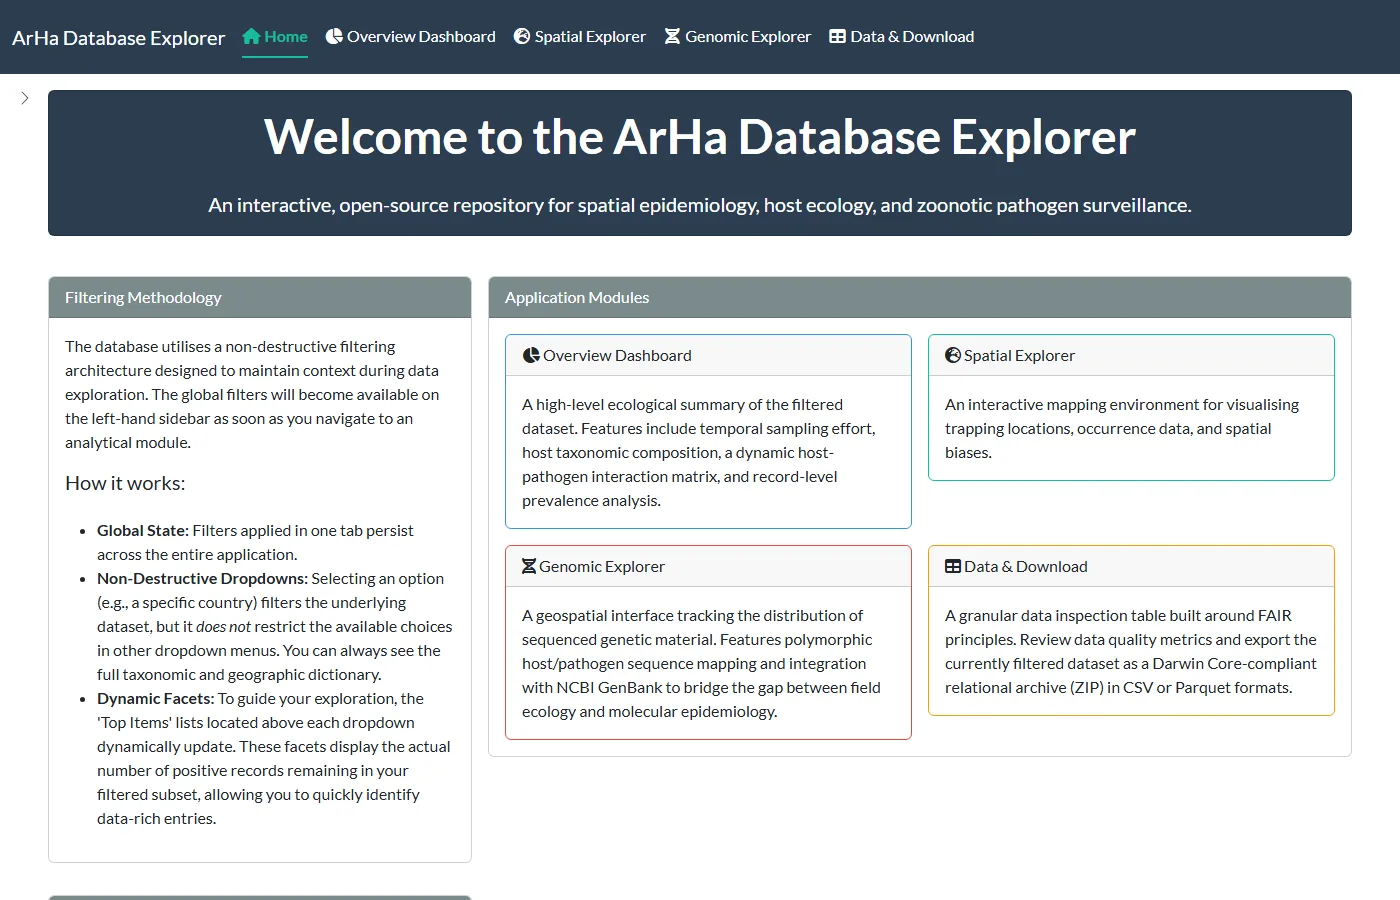
ArHa Database Explorer
Filters, maps and downloads the Project ArHa records of small mammals sampled for arenaviruses and hantaviruses, including linked sequences, in Darwin Core format.
Data standard
A minimum data standard for wildlife disease research and surveillance, from the Verena consortium, sets out 31 essential fields so that records from different studies can be combined. It records negative results to the same standard as positive ones, so that absence of a pathogen can be told apart from absence of sampling. It underpins the PHAROS database.
Data deposits
- Project ArHa. Global records of small mammals sampled for arenaviruses and hantaviruses, on Zenodo.
- Sierra Leone trapping study. Individual-level records of small mammals trapped and tested, on PHAROS.
- Rodent trapping studies in West Africa. The dataset from the review, on Zenodo, with an app to explore it.
- SCAPES baseline serosurvey. Aggregated data on Zenodo.
- Lassa virus host and case data. The tables on the Lassa epidemiology page, as hosts and cases (CSV).
Papers
Map Liberator: An open-source tool for recovering spatial epidemiological data from static situation reports
Simons D
Preprint, 2026
Summary
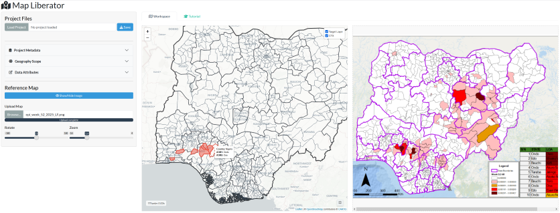
Sub-national surveillance data are often released only as choropleth or dot-density maps in PDF situation reports. Recovering the underlying values for spatial analysis has meant proprietary GIS, a steep learning curve in open-source alternatives, or manual transcription with its typographic and gazetteer errors.
Map Liberator is an open-source R and Shiny application for digitising such maps. A static image is overlaid on interactive GADM administrative boundaries to admin level 3, and binary, numeric or categorical attributes are assigned by selection and committed in batches. Output is joined to official unit names and identifiers rather than rasterised, so it is immediately usable in models.
As validation, eight years of Lassa fever notifications from Nigeria Centre for Disease Control weekly reports were extracted for 774 local government areas at under five minutes per map, producing a longitudinal dataset for evaluating high-resolution spatial risk models. The tool is disease and country agnostic.
‘SiteTool’: a ‘Shiny’ application for field site selection and evaluation
Imirzian N, Trebski A, Johnson E, Hewitson M, Simons D, Harden C, Friant S, Redding D
Preprint, 2025 · Ecography, 2026 · PDF (preprint)
Summary
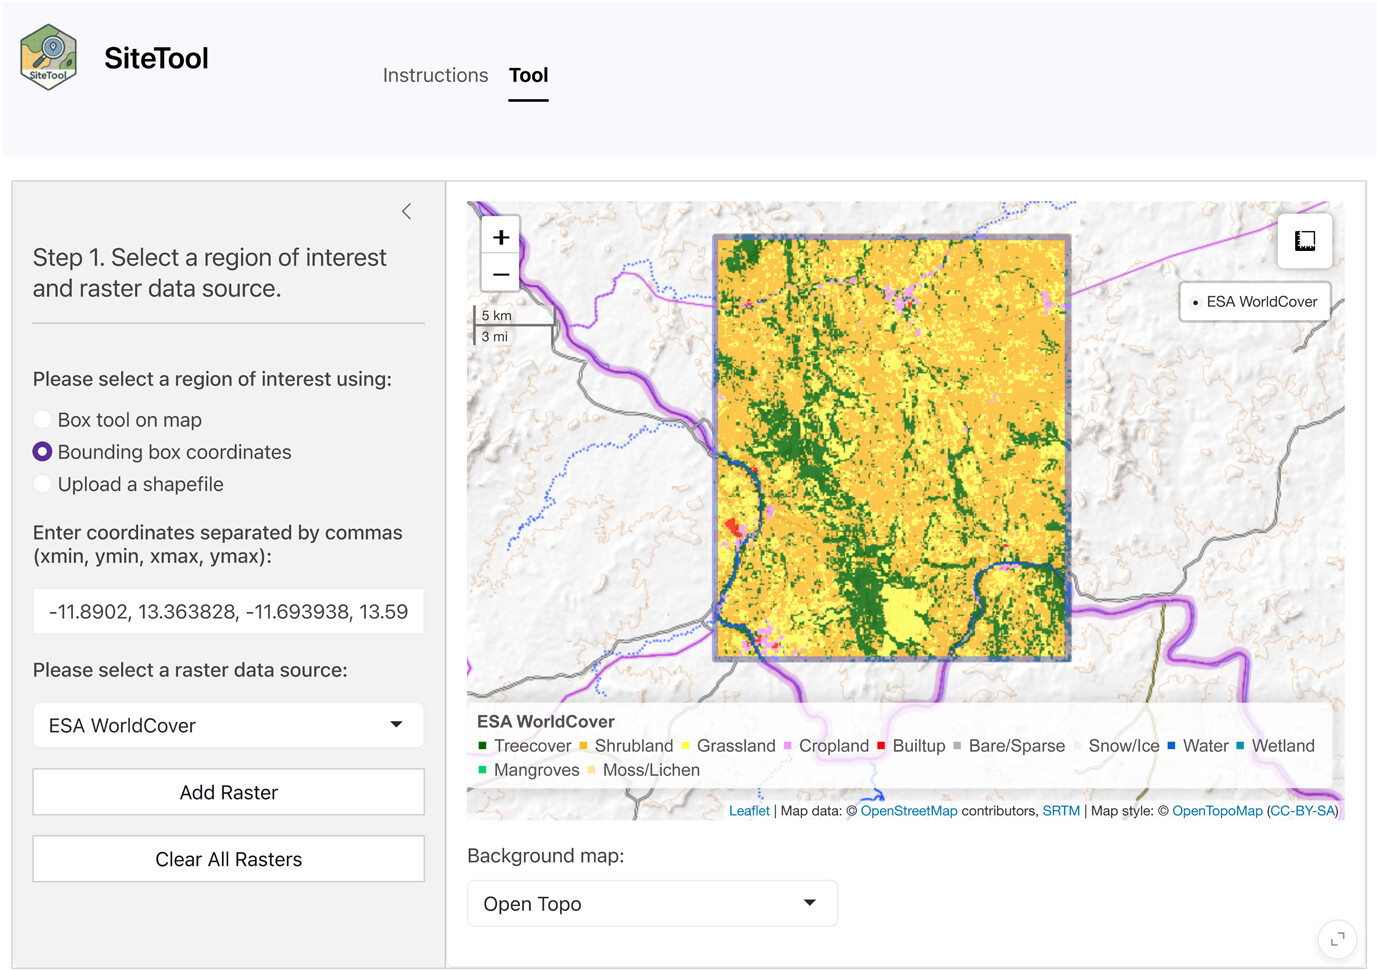
Field studies underpin ecological and epidemiological inference, yet site selection is often haphazard or driven by convenience. Poorly specified sampling designs bias input data and propagate into parameter estimates, which matters particularly when estimating zoonotic risk or species abundance. Remote-sensing layers could inform selection without pilot visits, but working with raw spatial data is a barrier for many field teams.
SiteTool is an open-source R Shiny application that puts that evaluation in a graphical interface. A region of interest is defined by map, bounding box or GeoJSON; candidate sites are generated as random points or extracted as populated places from OpenStreetMap; environmental gradients are queried within a specified radius from default layers such as ESA WorldCover, SRTM elevation and the Human Footprint Index, or from uploaded rasters. Built-in Mann-Whitney U tests compare selected sites against background points, so a design can be checked for environmental bias before fieldwork begins.
The tool structured the sampling frame for SCAPES in Nigeria, where 273 candidate communities within a three-hour drive were evaluated on cropland and grassland cover to span an agricultural gradient under logistical constraint.
A minimum data standard for wildlife disease research and surveillance
Schwantes CJ, Sánchez CA, Stevens T, Zimmerman R, Albery G, Becker DJ, …, Simons D, et al.
Preprint, 2024 · Scientific Data, 2025
Summary
Rapid data sharing matters for response to wildlife disease, but shared data are often unusable in aggregate because fields are defined inconsistently between studies. Negative results suffer worst, frequently omitted altogether, which makes it impossible to distinguish absence of pathogen from absence of sampling.
This paper, from the Verena consortium, specifies a minimum data standard for wildlife disease research and surveillance: 31 essential fields covering host taxonomy and sampling detail, pathogen assay method and result including negative findings, and precise spatio-temporal information for each record. The standard is deliberately minimal, aimed at what is needed for a record to be interpretable and combinable rather than at exhaustive metadata.
It underpins PHAROS, the consortium’s open-access database, and makes datasets FAIR in the operational sense of being integrable for large-scale analysis. Recording non-detection to the same standard as detection is what allows surveillance effort to be modelled alongside pathogen occurrence.
Last updated 5 October 2026